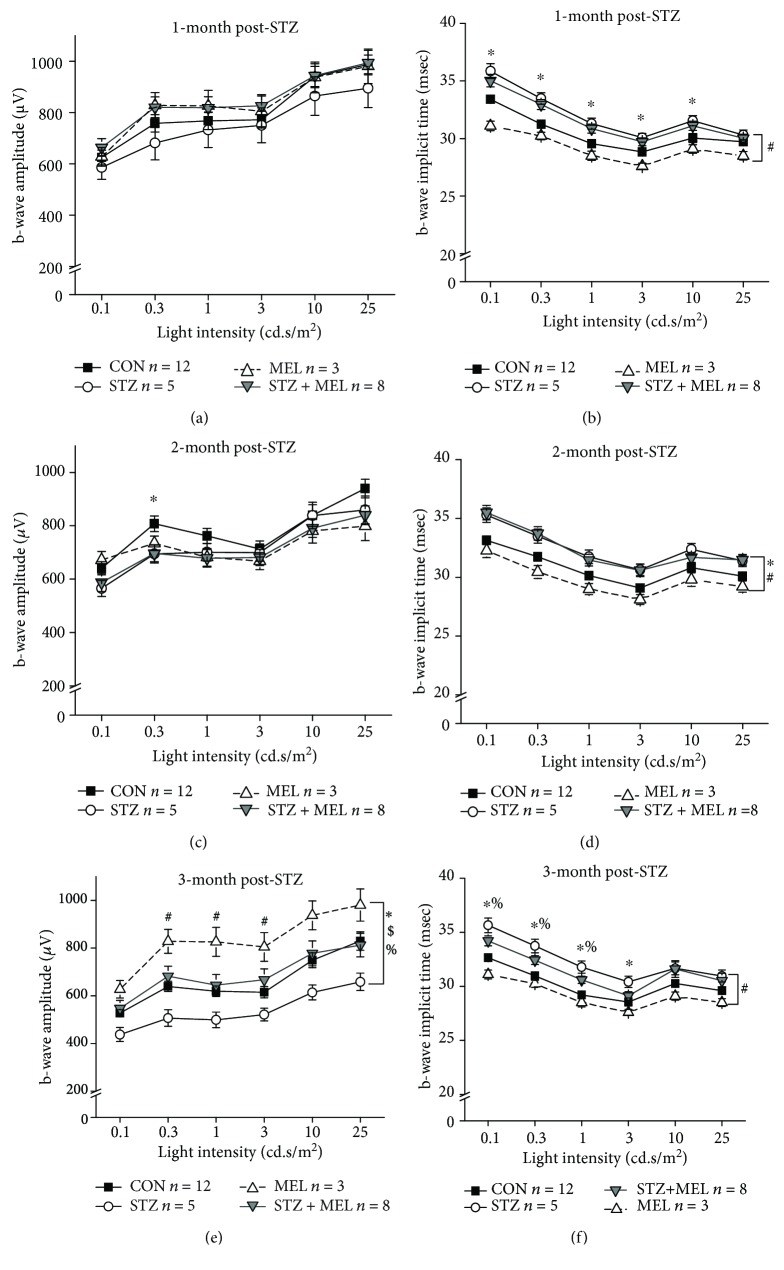
Figure 5.
Dark-adapted ERG b-wave amplitudes and implicit times recorded at one, two, and three months after STZ injections. The dark-adapted ERG b-wave amplitudes (a, c, e) and implicit times (b, d, f) in the control (CON), STZ-injected (STZ), melatonin-treated (MEL), and STZ-injected and melatonin-treated (STZ+MEL) mice at 1 month (a, b), 2 months (c, d), and 3 months (e, f) after the STZ injections. ∗ denotes a statistical significance between CON and STZ; # denotes a statistical significance between MEL and STZ+MEL; $ denotes a statistical significance between CON and MEL; % denotes a statistical significance between STZ and STZ+MEL; ∗p < 0.05.

