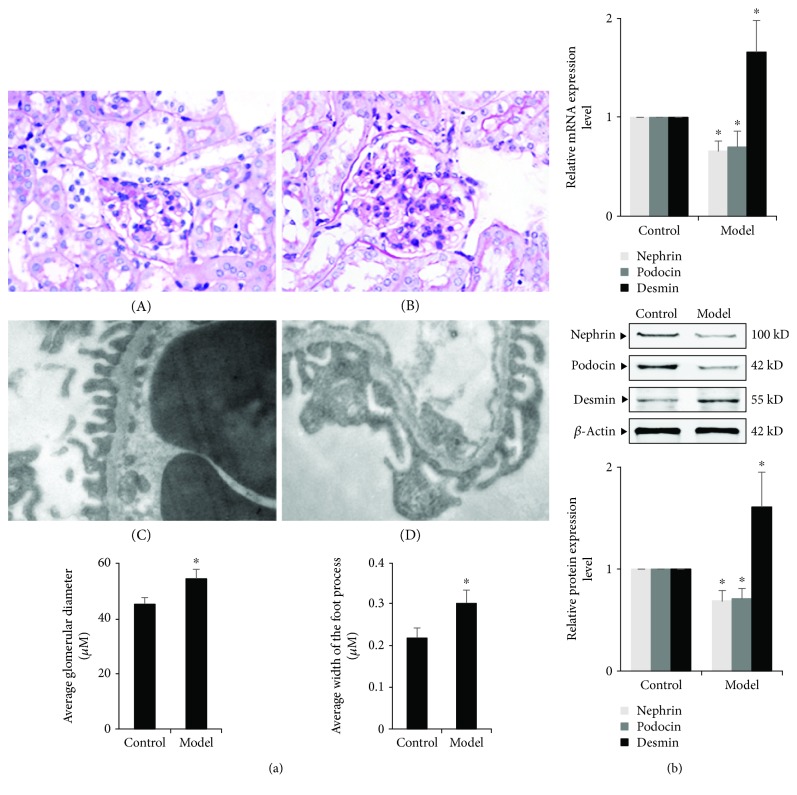
Figure 1.
Changes in glomerular diameter and podocyte of renal tissue in the ORG model. (a) Histology of renal tissues of different groups. A and B Light microscope of PAS staining (×400). The average glomerular diameter was measured and compared. C and D, Electron microscope of glomeruli (×20000). The average width of the foot process was measured and compared. Values are represented as mean ± SD (n = 10). (b) The relative mRNA and protein expression levels of nephrin, podocin, and desmin of the renal cortex were measured by real-time quantitative PCR and Western blot assay. The relative protein expression level was expressed as the target protein/β-actin ratio. Values are represented as mean ± SD. ∗P < 0.05 vs. control group, #P < 0.05 vs. ORG model group.

