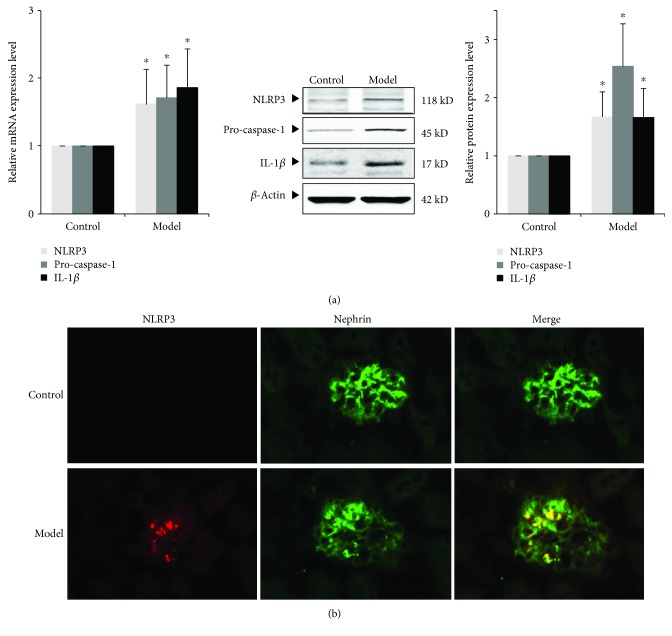
Figure 4.
Expression of NLRP3 inflammasome and IL-1β in renal tissue of ORG mice. (a) The relative mRNA and protein expression levels of NLRP3, pro-caspase-1, and IL-1β of the renal cortex were measured by real-time quantitative PCR and Western blot assay. The relative protein expression level was expressed as the target protein/β-actin ratio. Values are represented as mean ± SD. ∗P < 0.05 vs. control group, #P < 0.05 vs. ORG model group. (b) Double immunofluorescence staining of NLRP3 and nephrin of the ORG model. The localization of NLRP3 (red spots), nephrin (green spots), and merged image (yellow spots) in the frozen section of renal tissue of the ORG model (×400) is shown as indicated.

