Figure 3.
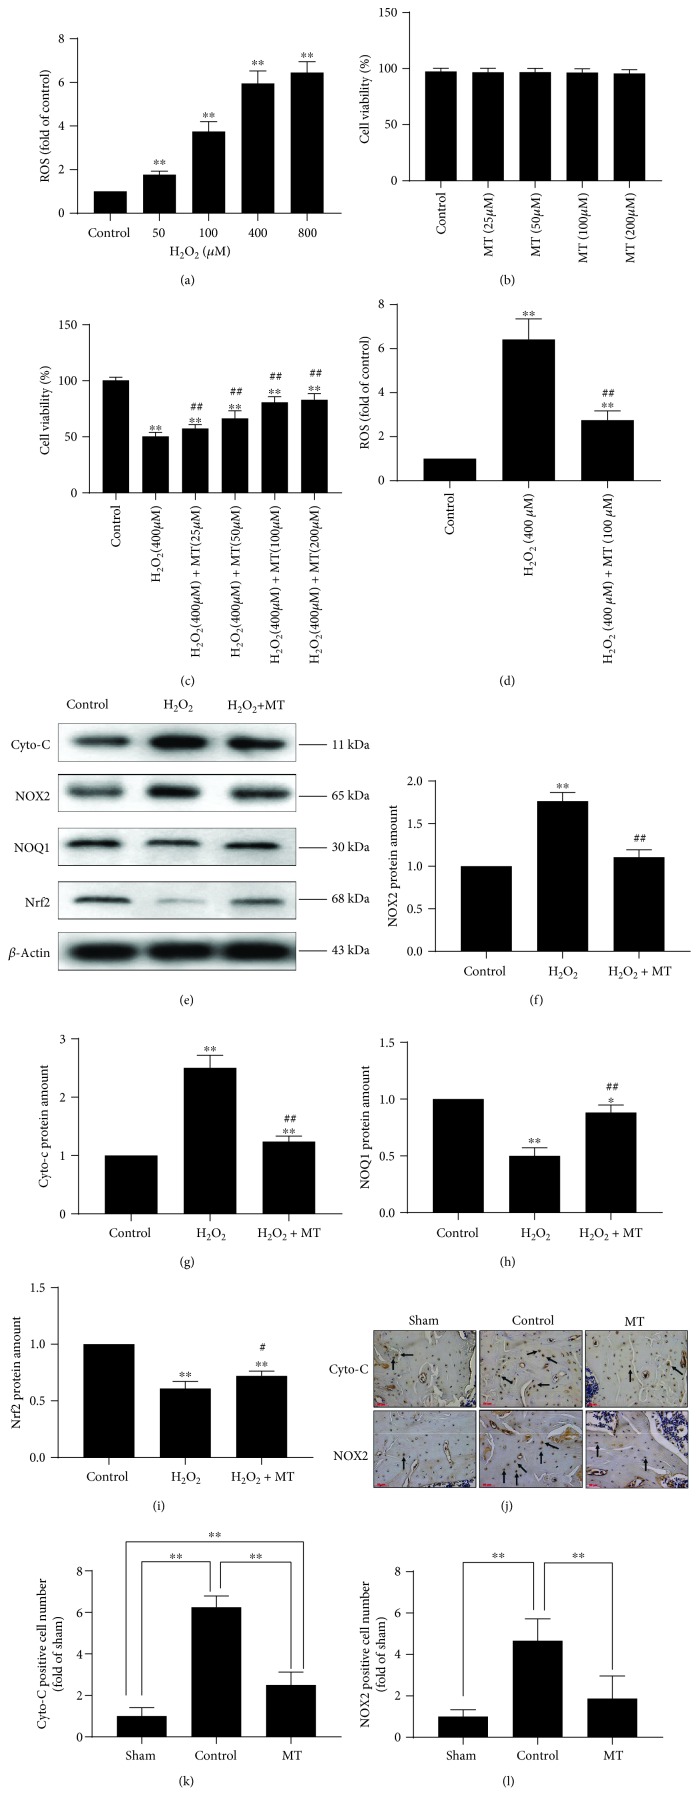
Melatonin alleviated mitochondrial oxidative stress in vitro and in vivo. (a) The correlation between different concentrations of H2O2 and ROS production (n = 3 per group, ∗P < 0.05 and ∗∗P < 0.01 vs. the control group). (b) The correlation among different concentrations of melatonin (0, 25, 50, 100, and 200 μM) and cell viability without H2O2, n = 3 per group. (c) The correlation among different concentrations of melatonin (0, 25, 50, 100, and 200 μM) and cell viability with H2O2 (400 μM) (n = 3 per group, ∗P < 0.05 and ∗∗P < 0.01 vs. the control group, #P < 0.05 and ##P < 0.01 vs. the H2O2 group). (d) Melatonin (100 μM) alleviated oxidative stress in the H2O2 (400 μM) model (n = 3 per group, ∗P < 0.05 and ∗∗P < 0.01 vs. the control group, #P < 0.05 and ##P < 0.01 vs. the H2O2 group). (e–i) Western blot of cyto-c, NOX2, NOQ1, and Nrf2 (n = 3 per group, ∗P < 0.05 and ∗∗P < 0.01 vs. the control group, ∗P < 0.05 and ∗∗P < 0.01 vs. the H2O2 group). (j–l) Immunostaining of cyto-c and NOX2 (n = 10 per group, ∗P < 0.05 and ∗∗P < 0.01).

