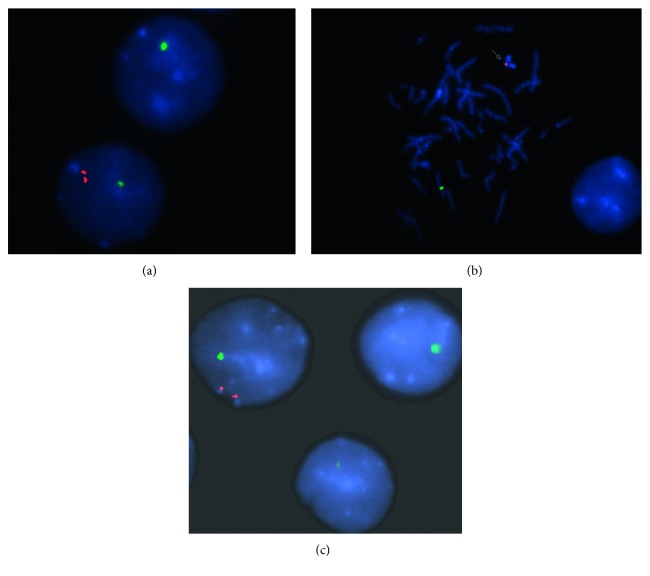
Figure 2.
(a) FISH analysis depicting two interphase cells. Top: a cell showing only one green signal for the centromeric X region (DXZ1) indicating a 45,X cell; bottom: the cell shows one green signal (DXZ1) and two distinct but proximal red signals for the Y centromeric region (DYZ3) present on the idic (Y) chromosome. (b) FISH analysis using probes for the centromeric X region (DXZ1, green) and for the sex-determining region of Y chromosome on Yp11.3 (SRY, red) on a metaphase spread showing one signal on the chromosome X and one condensed signal on the idic (Y) (arrow) and (c) on interphase cells showing two hybridizations signals for the SRY region in mosaic.

