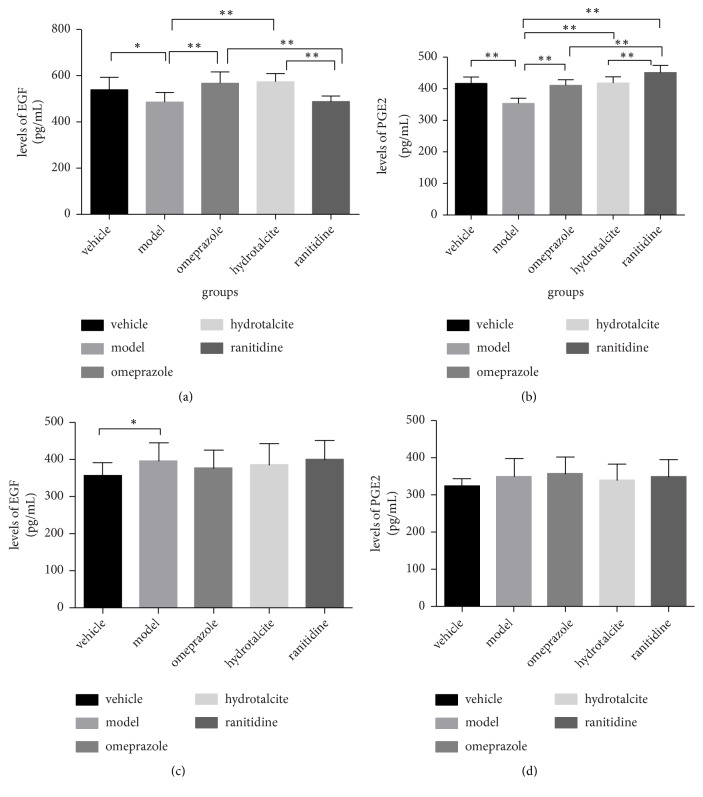
Figure 2.
(a) Levels of EGF in blood serum in preventive experiment. (b) Levels of PGE2 in blood serum in preventive experiment. (c) Levels of EGF in blood serum in therapeutic experiment. (d) Levels of PGE2 in blood serum in therapeutic experiment. Results are the means±SD (N=10), ∗p < 0.05 and ∗∗p<0.01.

