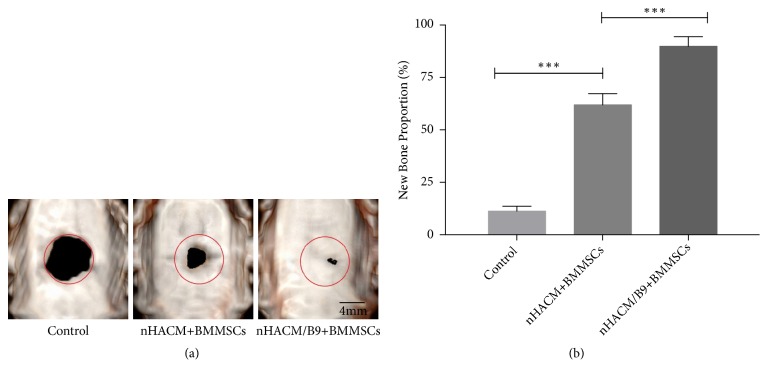
Figure 7.
In vivo radiographic examinations at 12 weeks of repair. (a) Analysis of the CT images showed that the nHACM/B9+BMMSC group had a significantly larger area of new bone regeneration among the three groups. The nHACM+BMMSCs group had a significantly larger area of new bone regeneration than the control group. Red circles denote the original bony defects. (b) The proportion of newly formed bone in the control, nHACM+BMMSC, and nHACM/B9+BMMSC groups. Mean±SD; n=3; ∗p<0.05, ∗∗p<0.01, and ∗∗∗p<0.001.

