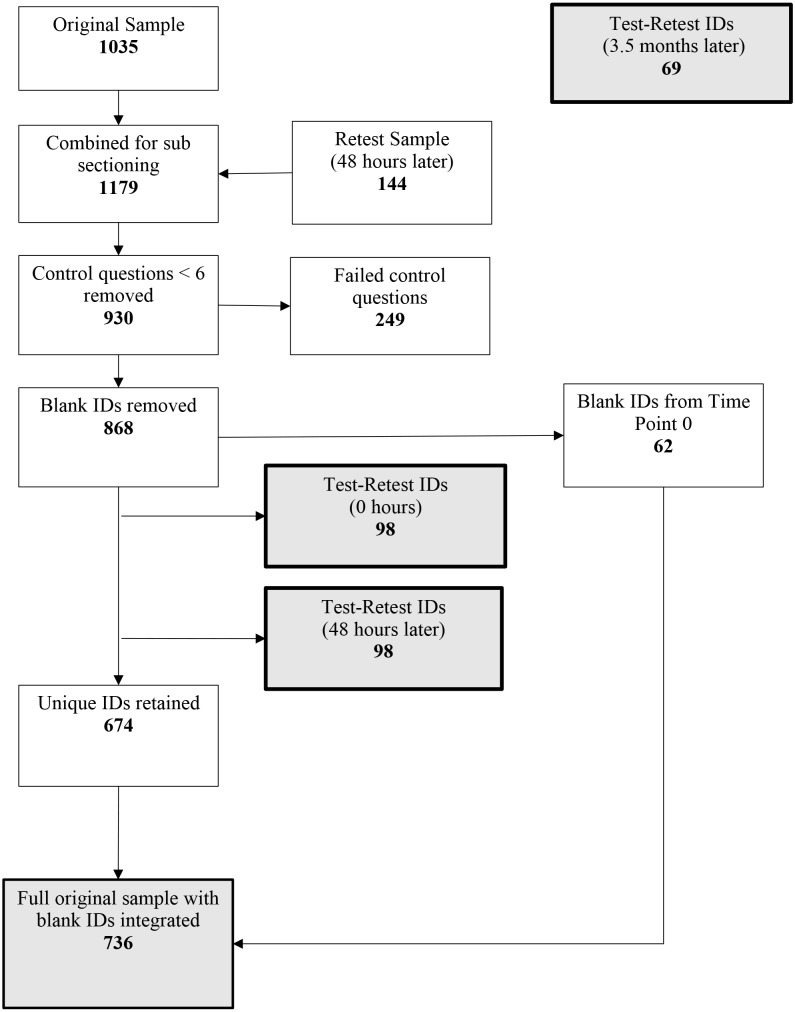
Figure 1. Path diagram to illustrate data cleaning, control, and sub-setting of the original sample (n = 736), retest 1 (0 h, n = 98), retest 2 (48 h, n = 98) and retest 3 sample (n = 69).
Grey boxes indicate final samples used for analysis. Blank IDs from the original sample were removed. This ensured that only blank IDs were from ‘0 h’ participants and not from the retest sample (48 h). Therefore, they were able to be reintegrated after the separation of the retest sample.

