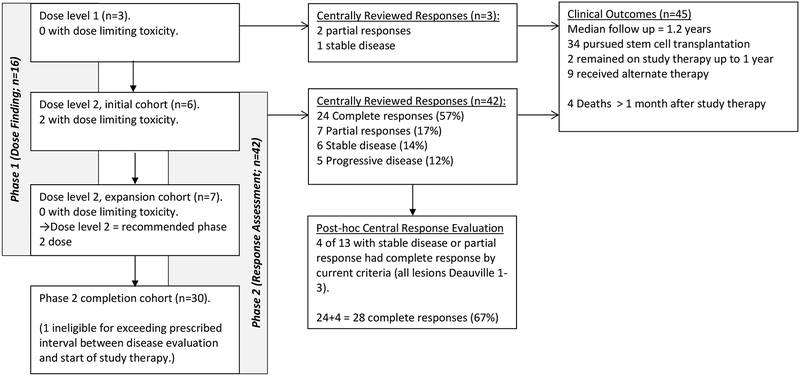
Figure 1. Trial Diagram.
Outcome for all patients enrolled on study. Subjects in both the Phase 1 (dose finding) and Phase 2 (complete response rate) portions are included. Subjects were treated at either dose level 1 (1.4 mg/kg/dose of Brentuximab vedotin) or dose level 2 (1.8 mg/kg/dose of Brentuximab vedotin). Results of primary outcomes and clinical outcomes are indicated.

