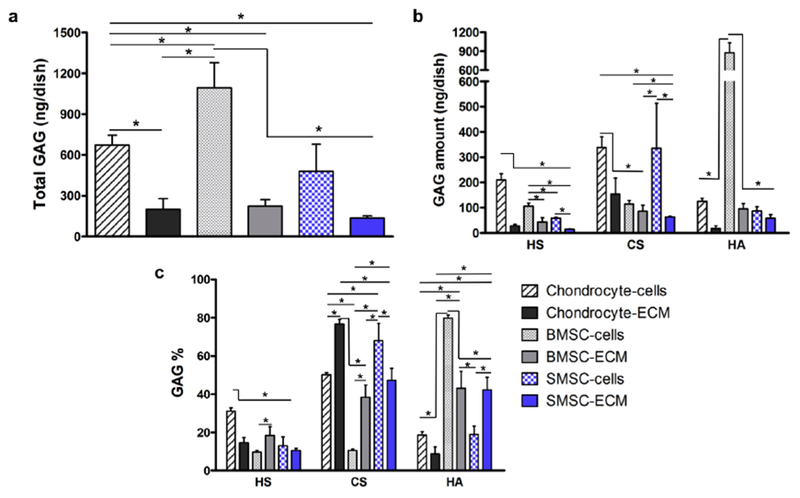
Fig. 7.

Effect of the decellularization protocol on total GAG (a) and HS, CS and HA amounts (b) presented as ng obtained in each culture dish before and after the treatment. Average percentage GAG composition of the different cell-derived ECM and cell culture monolayers (c). Results are presented as mean ± SD of three independent samples (n = 3); *p < 0.05.
