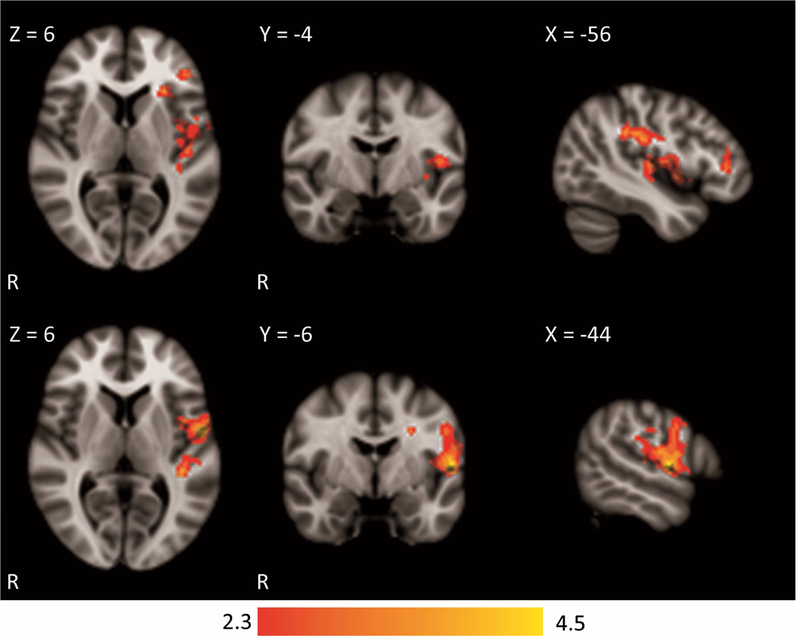
Figure 2:

Significant Clusters from the Two-Way Mixed Effects Analysis of Variance (ANOVA) Note: Coordinates represent the location of the slices displayed. Top row: results from right putamen cluster with maximum z-score of 3.85 located at x = −40, y = −30, z = 30. Bottom row: results from left putamen cluster with maximum z-score of 4.6 located at x = −40, y = −34, z = 28.
