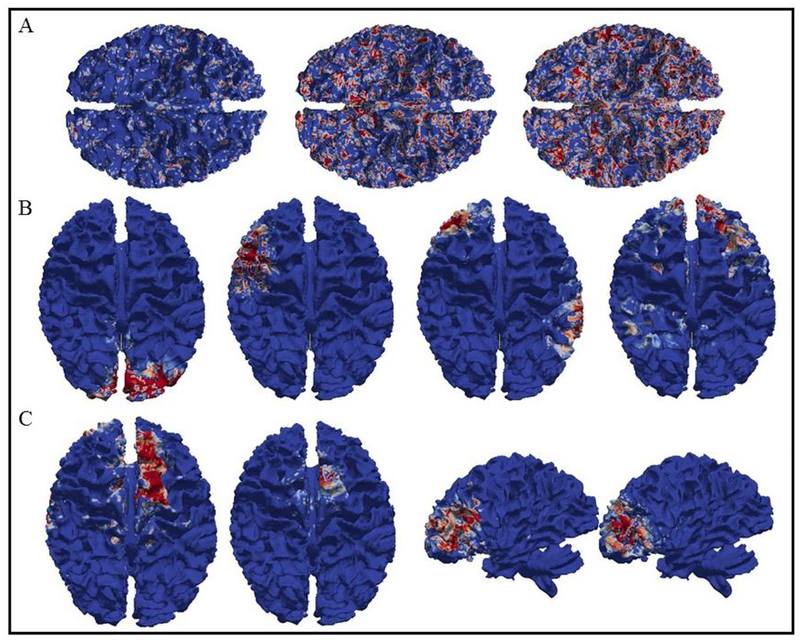
Fig. 6.
Illustration of examples of evaluation results. A. The brain networks obtained from DBN model by using 7 functional networks without using trace-map algorithm. B. The brain networks obtained from DBN model by using 7 functional networks including the trace-map algorithm. C. Examples of the networks obtained from DBN model by using 2800 functional networks and 7 functional networks, respectively. In each pair, brain networks from the model of using 2800 functional networks are on the left, brain networks from the model of using 7 functional networks are on the right.

