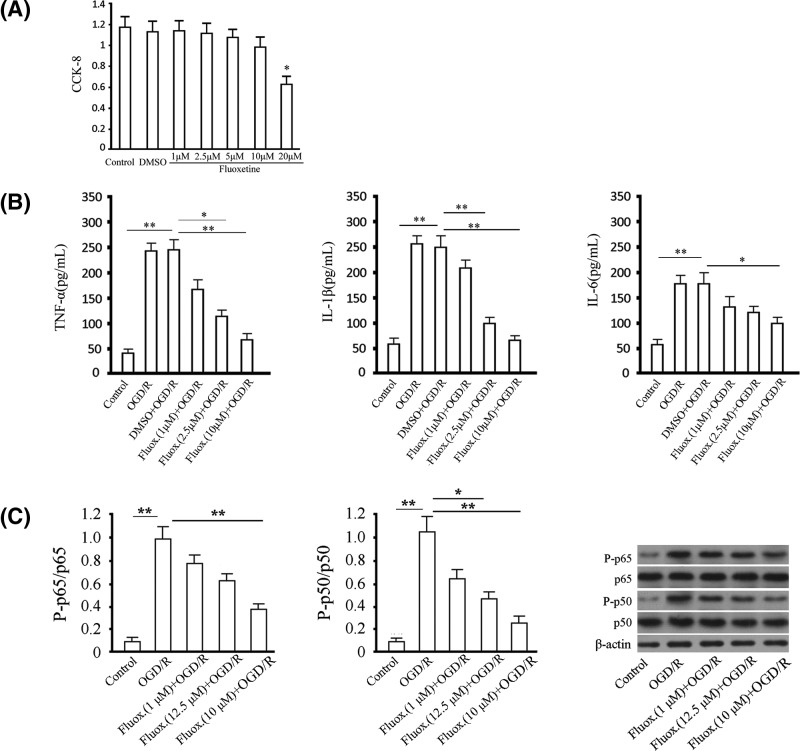
Figure 1. Anti-inflammatory effect of fluoxetine in an OGD/R model of BV-2 cells.
(A) Cell viability was assessed by CCK-8 assay. The x-coordinate represented time points, and the y-coordinate represented the absorbance at 450 nm for the analysis of cell proliferation. (B) The levels of TNF-α, IL-1β, and IL-6 in supernatant were
examined using ELISA assay. (C) The levels of p65 and p50 phosphorylation were detected by western blotting. Total p65 and p50 were detected as reference for phosphorylated p65 and p50. Quantitative analysis and representative images were provided. Tests were carried out on three biological triplicates. *P<0.05; **P<0.01.

