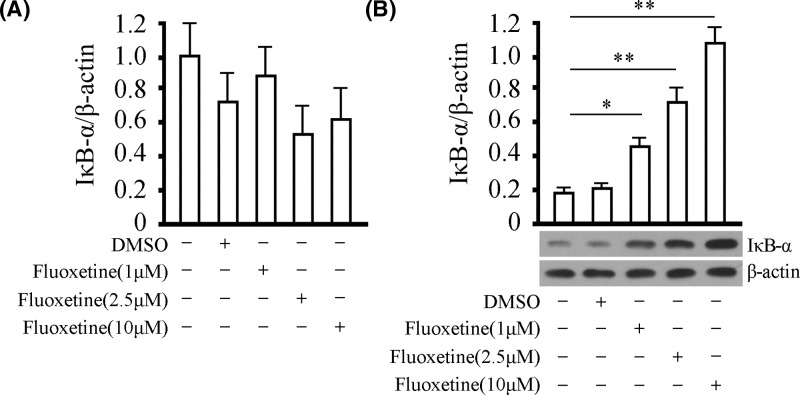
Figure 2. Effect of fluoxetine on the level of IκB-α under OGD/R.
(A) The level of IκB-α in mRNA was detected by real-time PCR in BV-2 cells under OGD/R. Quantitative analysis was provided for the level of IκB-α in mRNA in different groups. (B) The level of IκB-α in protein was detected by western blotting in BV-2 cells under OGD/R. Quantitative analysis and representative images were provided for the level of IκB-α in protein in different groups. Tests were carried out on three biological triplicates. *P<0.05 versus DMSO group, **P<0.01 versus DMSO group.

