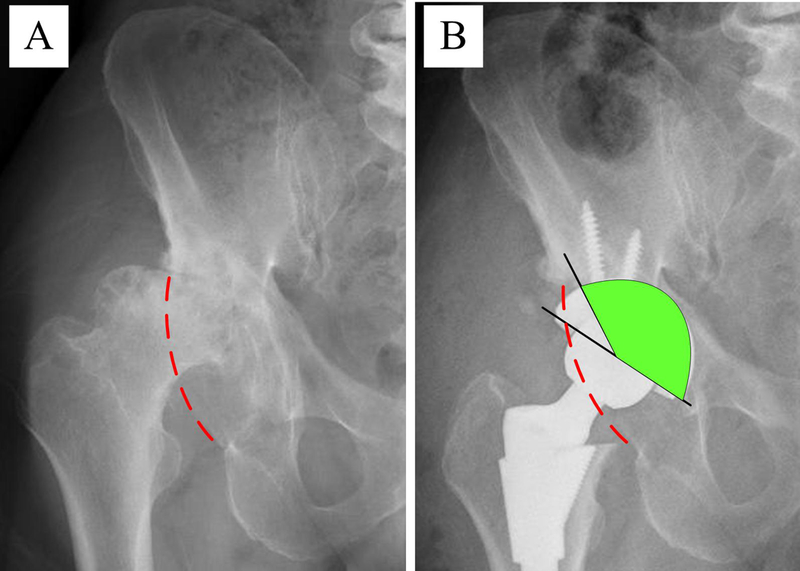
Figure 5A-B.

Schematic diagram illustrating why the 2D radiographically determined cup coverage tended to underestimate the in vivo determined cup coverage. Preoperative (A) and postoperative (B) anteroposterior pelvic radiographs. The red dashed line represents the edge of the posterior acetabulum; the green region represents the 2D radiographic cup coverage. In this case, the 2D radiographically determined and the in vivo determined cup coverage were 83.80% and 96.03%, respectively. The biggest single Δ cup coverage equaled 12.23%.
