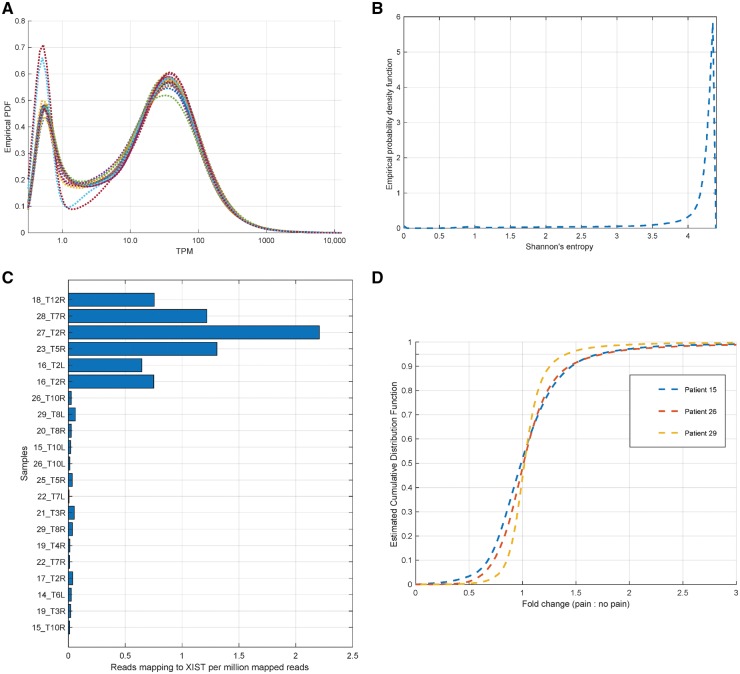
Figure 3.
In silico controls for RNA-sequencing analysis. (A) The estimated probability density function for transcripts per million (TPMs) (smoothed by adding 0.5 to each value) show that all samples have approximately similar distributions over coding gene TPMs, along with a consistent number of genes expressed at 1.5 TPM or higher in each sample (between 13 850 and 14 715). (B) Genes with high variability in TPM across our datasets were identified in a fashion agnostic to clinical information by calculating Shannon’s entropy for each gene’s TPMs across RNA-seq samples, identifying genes with high variability (based on low entropy values in the left tail of the estimated distribution, value <3.5). Higher values correspond to more generic expression patterns. (C) Some well-known marker genes were checked in RNA-seq samples. The reported sex for each sample was independently verified using reads mapping to the XIST non-coding gene. (D) Estimated density function for the gene expression (for genes with transcripts per million >3.0 in either sample) fold change between pain and non-pain samples derived from the same patient, showing that a 2-fold change corresponds to the top 5th percentile.

