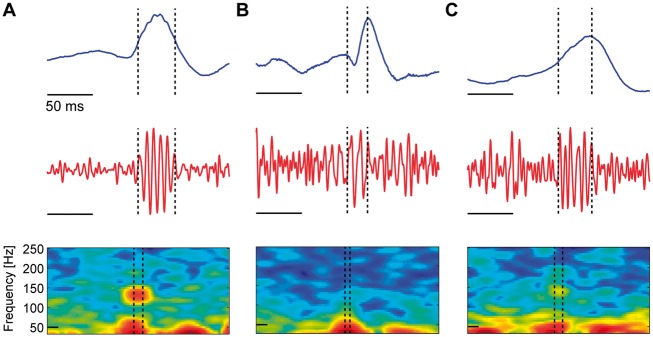
Figure 1.
Three example candidate spike ripple events. Each subfigure displays the unfiltered EEG data (blue), the bandpass filtered EEG data (100–300 Hz, red), and the spectrogram of the EEG data in an interval surrounding the spike ripple event (dashed vertical lines) with power (in decibels) shown in colour. Both reviewers classified the candidate spike ripple events (A) as a true spike ripple, (B) as a false spike ripple, or (C) the reviewers disagreed on the classification. In A, a distinct high frequency ‘spectral island’ is visually evident in the spectrogram, and a ripple is visually evident on the spike in the unfiltered data.

