Figure 1.
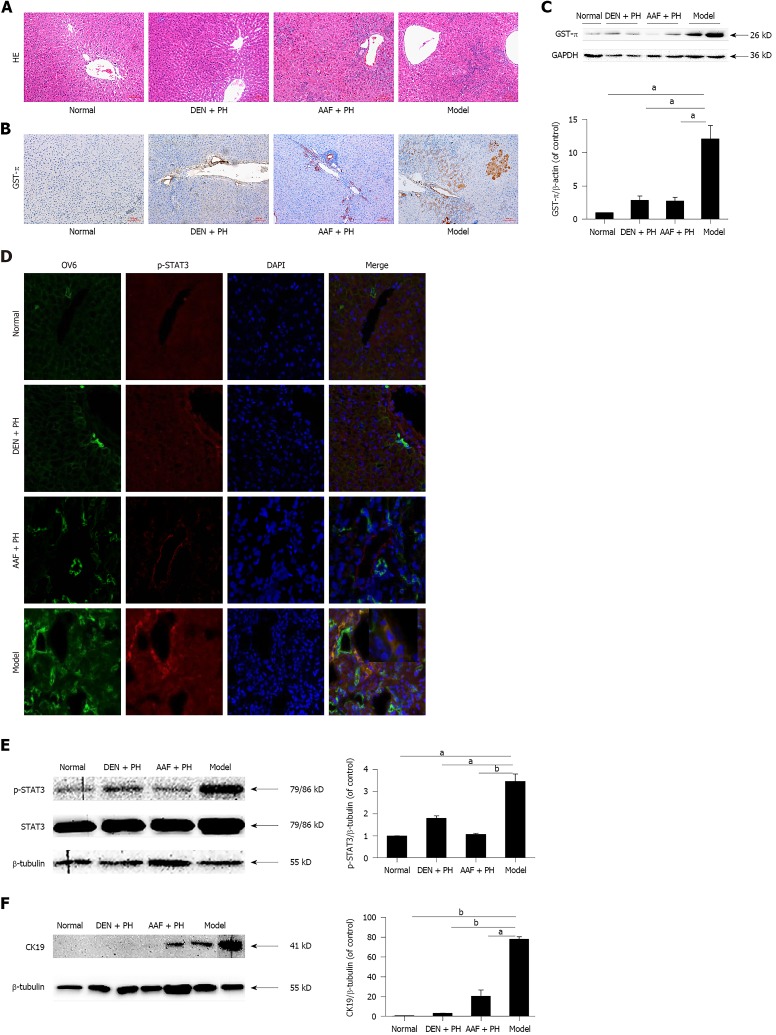
Pathological changes in liver precancerous lesions in rats. A: Heterocellular clusters were observed in the model group by hematoxylin and eosin staining. Scale bars: 100 μm. B and C: Glutathione S-transferase-π was highly expressed in the model group, as revealed by immunohistochemistry and Western blot. Scale bars: 100 μm. D: Immunofluorescence images showing that p-signal transducer and activator of transcription 3 (STAT3) was highly expressed in activated oval cells in the model group compared with the diethylnitrosamine (DEN) + partial hepatectomy (PH), acetylaminofluorene (AAF) + PH, and normal groups. Scale bars: 50 μm. E: Western blot analysis showed that p-STAT3 was highly expressed in the model group compared with the DEN + PH, AAF + PH, and normal groups. F: Western blot analysis showed that cytokeratin 19 was highly expressed in the model group compared with the DEN + PH, AAF + PH, and normal groups. All values are the mean ± SEM derived from three independent experiments (aP < 0.05, bP < 0.01). GST-π: Glutathione S-transferase-π; STAT3: Signal transducer and activator of transcription 3; CK19: Cytokeratin 19; DEN: Diethylnitrosamine; PH: Partial hepatectomy; AAF: Acetylaminofluorene; HE: Hematoxylin and eosin; OV6: Oval cell 6.

