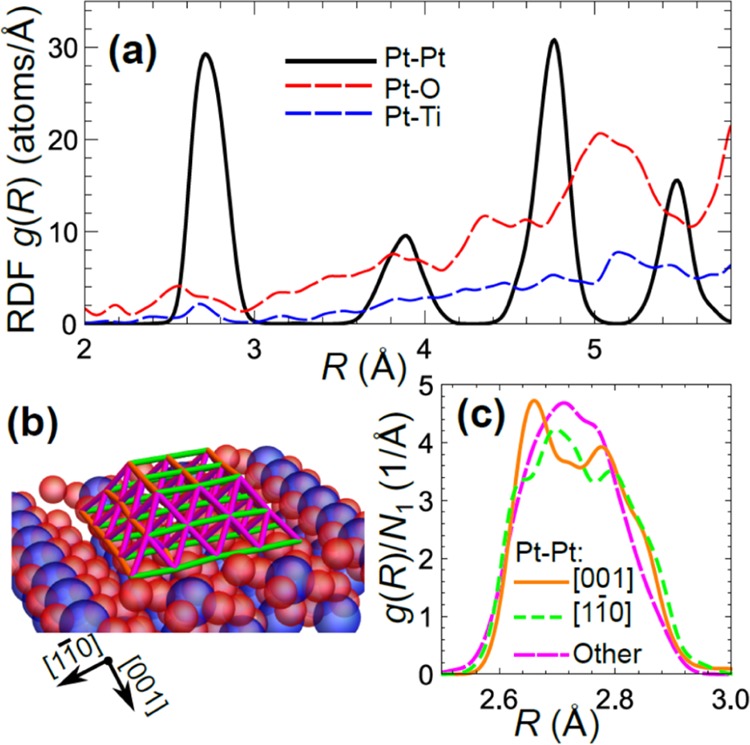
Figure 6.

Partial RDFs (for Pt–Pt, Pt–O, and Pt–Ti bonds) for Pt NPs on TiO2(110), obtained in RMC simulations with three different X-ray polarizations data analyzed simultaneously (a). In case of Pt–Pt bonds, one can distinguish between Pt–Pt bonds aligned parallel to substrate and its [11̅0] direction (green), aligned parallel to [001] direction (orange) and other bonds oriented at 60° to the substrate (magenta) (scheme in (b)). Corresponding bond-length distributions are shown separately in (c). For better comparison, bond-length distributions are normalized by the corresponding CN in (c).
