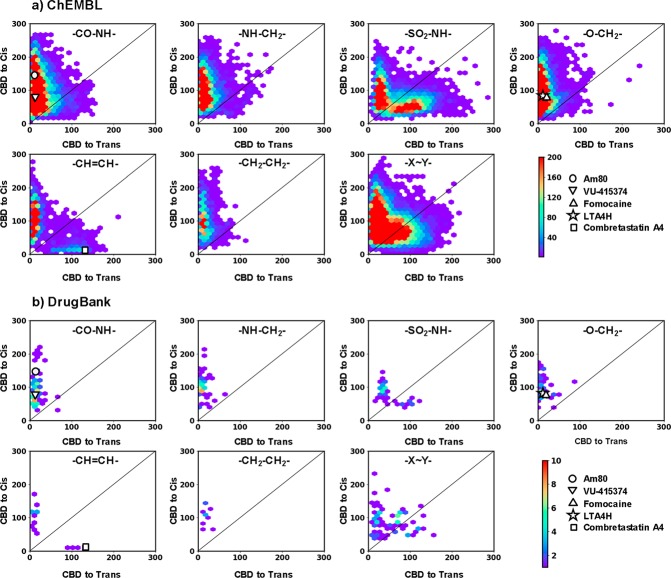
Figure 5.
Scatter plots showing the 3D shape similarities of potential azologable compounds toward their cis-azolog (vertical axis) and trans-azolog (horizontal axis), for compounds from PDB (a) and CSD (b). 3D Shape similarities are reported as the city block distance (CBD) in the 3DAPfp, with lowest value indicating highest similarity. Scatter plots are shown for six highly populated linker groups and rest of the groups merged together (−X–Y−). Each of the scatter plots is marked with the structure of respective linker type. Color scale shows the density of molecules. The compounds further investigated in this study are highlighted on the scatter plots.

