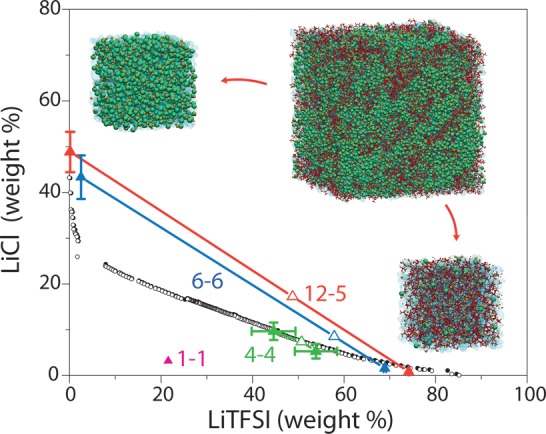
Figure 3.

Phase diagram of the ternary LiCl/LiTFSI/H2O mixture. The phase boundary is located by cloud point experiments; filled black circles correspond to data for a biphasic system, and empty circles correspond to data for a monophasic system. Tie lines are obtained by MD simulations for 12m–5m (red), 6m–6m (blue), 4m–4m (green), and 1m–1m (magenta) LiCl–LiTFSI systems and relate the global composition of the system (empty triangles) to that of the resulting phases (filled triangles). MD simulation snapshots illustrate the initial system for the 12m LiCl–5m LiTFSI composition and resulting LiCl and LiTFSI-rich phases (note that the latter are only close-ups on each phase, because the complete system contains both of them separated by interfaces, as shown in Figure 2B).
