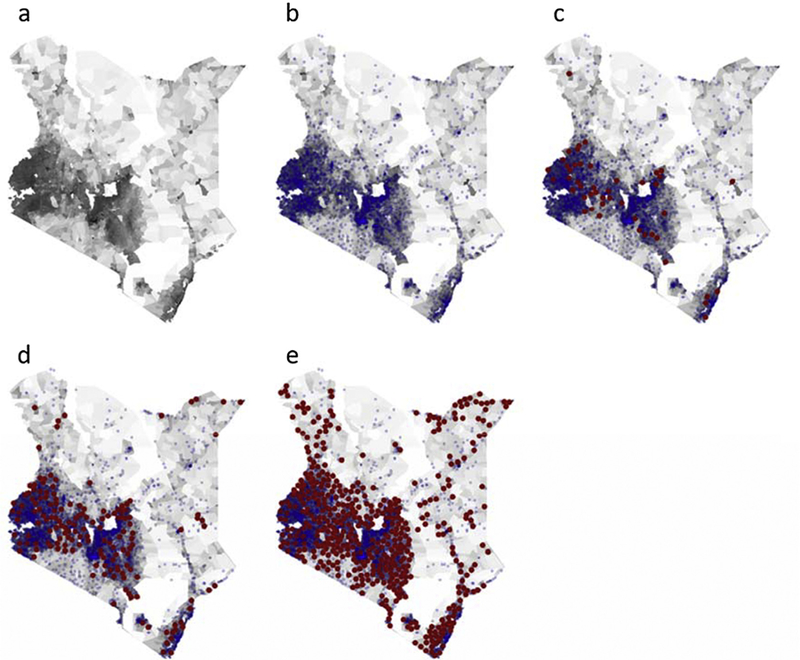
Fig. 1.

Maps of Kenyan population and fixed and proposed outreach vaccination locations used to model cost-effectiveness of vaccinating geographically hard-to-reach target populations with measles 1st and 2nd doses, 2016–2020. (a) Displays the population density where darker shaded regions are more densely populated; (b) shows in blue the assumed 5 km (km) in radius catchment areas of each existing fixed vaccination post; (c), (d), and (e) overlay in red the 10 km in radius catchment areas for proposed outreach locations necessary to include 25%, 50% and 75% of the geographically hard-to-reach children <12months, respectively. (For interpretation of the references to colour in this figure legend, the reader is referred to the web version of this article.)
