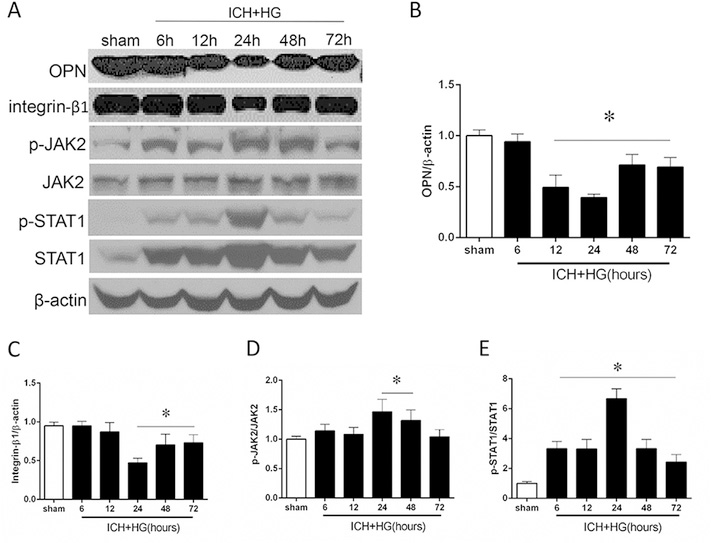
Fig. 1. Time dependent expression changes of OPN and downstream proteins after hyperglycemic intracerebral hemorrhage (ICH + HG).
(A) Representative western blot image and (B) quantitative analyses of the OPN, (C) Integrin-β1, (D) JAK2 and (E) STAT1. n = 6 per group. All data are expressed as mean ± SEM. *P < 0.05 vs. sham.

