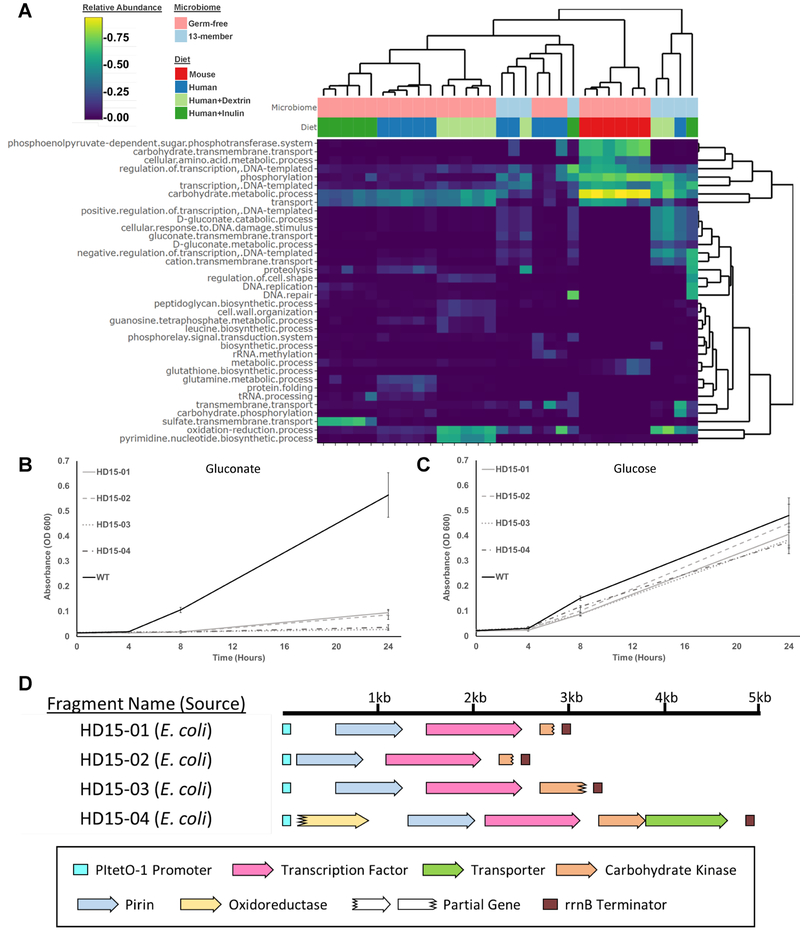
Figure 3. Comparison of functions enriched in functional selections in mice with different gut microbiome complexities.
A) Heatmap of the relative abundances of GO classifications present in EcN mono-colonized mice and mice pre-colonized with a 13-member defined community at the end of the selection period. Dendrograms represent the clustering applied to group similar rows/columns of the heatmap. B) Growth curves of EcN strains harboring metagenomic inserts shown in D on gluconate minimal media, or (C) glucose. N = 6 experimental replicates, error bars represent one standard deviation above and below the mean. D) Annotations of the metagenomic fragments characterized in B-C. See also Figure S2, S4–S5, and Table S6.

