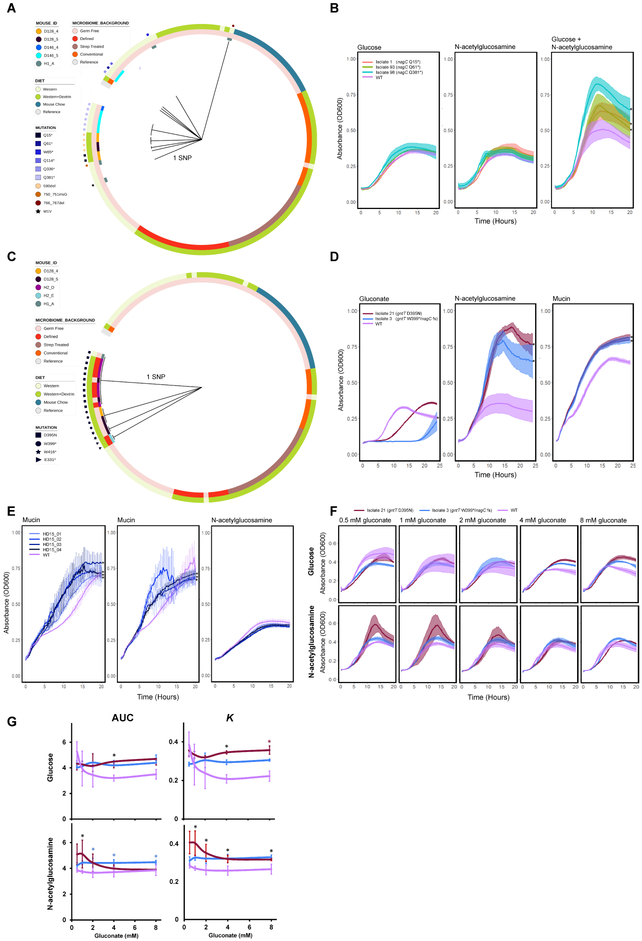
Figure 5. Phylogenies and phenotypic effects of nagC and gntT mutations.
Maximum parsimony gene phylogenies for adapted isolates based on their nucleotide sequences for A) nagC and C) gntT. The length of the branches corresponds to the number of SNPs separating the isolate gene sequence from the reference sequence. Color tracks depict the treatment conditions and the Mouse IDs from which isolates were isolated. The prefix of each Mouse ID indicates the cage in which the mouse was housed. B) Growth curves of nagC mutants on 0.4% glucose minimal media (left), 0.4% GlcNAc minimal media (middle), and 0.2% GlcNAc and 0.2% glucose minimal media (right). N = 3 experimental replicates per strain, * P < 0.05, Welch’s t-tests comparing the K parameter of logistic growth models fit to the data for WT or the mutant isolates, with Benjamini-Hochberg correction for multiple comparisons. D) Growth curves of gntT or gntT/nagC double mutants on gluconate (left), GlcNAc (middle), or porcine gastric mucin minimal media (right). ‘fs’: frameshift mutation S197T. * P < 1×10⁻⁵, Welch’s t-tests comparing the empirical areas under the curves for WT and the mutant isolates, Bonferroni correction for multiple comparisons. E) Growth curves of EcN transformed with plasmid-borne gntR-containing inserts from the functional metagenomic selections in 1.5% porcine gastric mucin (left, middle, 2 independent experiments), or in 20 mM GlcNAc minimal media (right). N = 4–6 experimental replicates per strain, *P < 0.05, Welch’s t-tests comparing the empirical areas under the curves for WT and the mutant isolates, Benjamini-Hochberg correction for multiple comparisons. F) gntT mutants were grown in 20 mM glucose (top) or 20 mM GlcNAc (bottom) minimal media supplemented with indicated gluconate. G) Summary of F, showing the areas under the growth curves (AUC) and the K parameter of logistic growth models fit to the data. N = 2–4 experimental replicates per strain, * P < 0.05, Welch’s t-tests, Benjamini-Hochberg correction for multiple comparisons. Black stars indicate both Isolates 3 and 21 had a significantly greater value than WT at a given gluconate concentration. Blue – only Isolate 3. Red – only Isolate 21. For all panels, K and AUC values were calculated using the growthcurver R package. Error bars and shaded regions represent one standard deviation above and below the mean. See also Figure S7.

