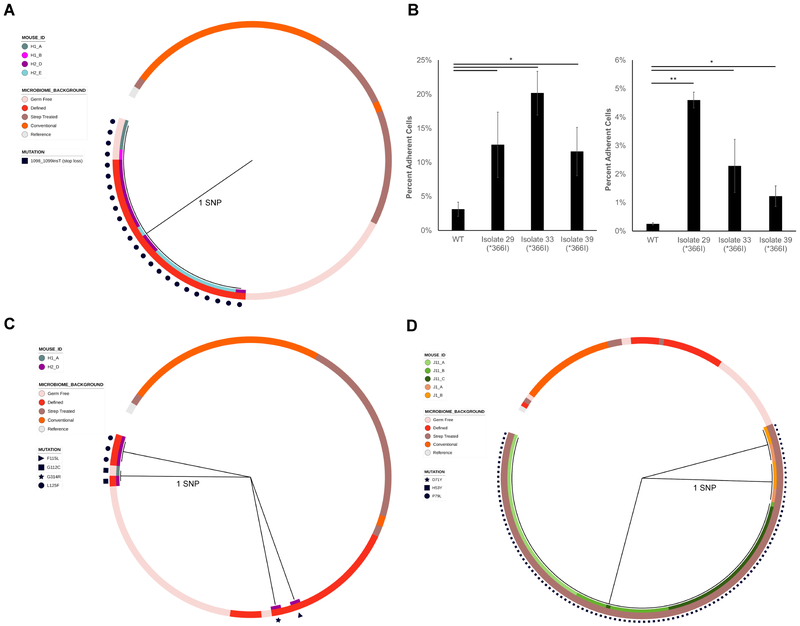
Figure 6. Phylogenies and phenotypic effects of kfiB, sgrR, and rsmG mutations.
Maximum parsimony gene phylogenies for adapted isolates based on their nucleotide sequences for A) kfiB, C) sgrR, and D) rsmG, as in Figure 5 B) Percentages of kfiB mutant cells adherent to Caco-2 (left) or HT29-MTX (right) monolayers after 3 washes. Shown are the means of ratios of adherent CFU to total CFU counts (N = 3 experimental replicates). Error bars are one standard deviation above and below the mean. * P < 0.05, ** P < 0.001, Welch’s t-test with Benjamini-Hochberg correction for multiple comparisons.

