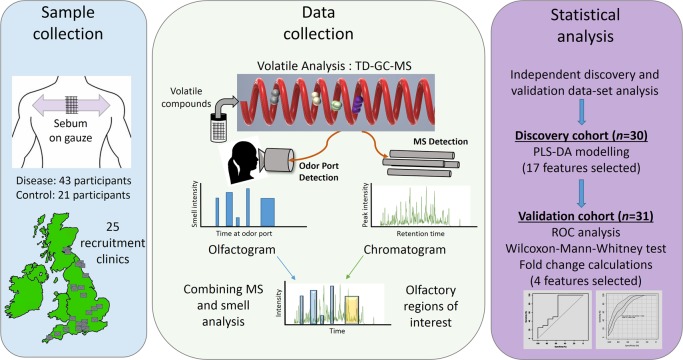
Figure 1.
Schematic outline of the workflow described in this study - from sample collection to biomarker discovery. Parkinson’s disease patient samples and control participant samples were collected from 25 sites across the UK using gauze swabs to sample the sebum from the top back region from 64 people. Thermal desorption–gas chromatography–mass spectrometry (TD–GC–MS) analysis was performed alongside olfactory analysis, results of which were then combined. Statistical analysis was performed on two independent cohorts. Data from discovery cohort consisting of 30 participants were used to create a partial least-squares-discriminant analysis (PLS-DA) model, and differential features found as a result were then targeted for the presence in a separate validation cohort consisting of 31 participants. The significance of these biomarkers was tested using receiver operating characteristic (ROC) analyses and the Wilcoxon-Mann–Whitney test. Finally, four features that showed similar statistical significance and expression in both cohorts were selected for biological interpretation of data.

