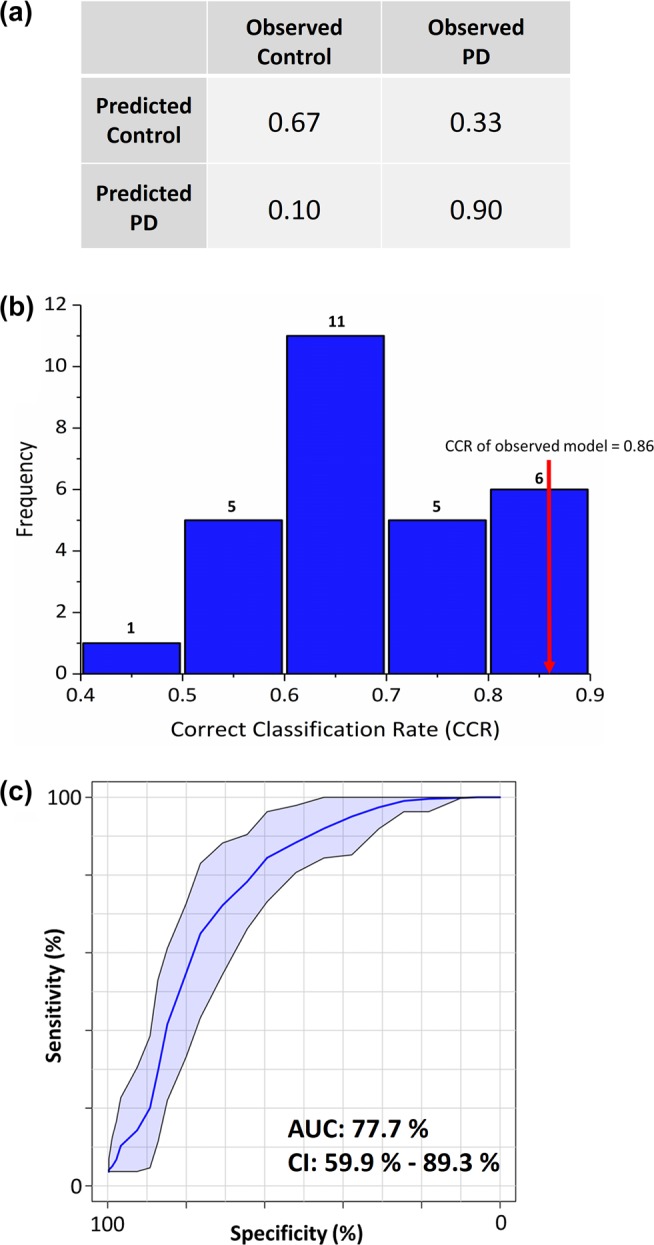
Figure 2.

PLS–DA classification model. (a) Classification matrix of PLS–DA model validated using 5-fold cross validation showing 90% correct prediction of Parkinson’s disease samples. (b) PLS–DA modeling was further tested using permutation tests (where the output classification was randomized; n = 28), and results were plotted as a histogram which showed frequency distribution of correct classification rate (CCR) which yielded CCRs ranging between 0.4 and 0.9 for permutated models. The observed model was significantly better than most of the permuted models (p < 0.1), shown by the red arrow. (c) ROC plot generated using combined samples from both cohorts and the panel of four metabolites that was common and differential between control and PD. The shaded blue area indicates 95% confidence intervals calculated by Monte Carlo cross validation (MCCV) using balanced subsampling with multiple repeats.
