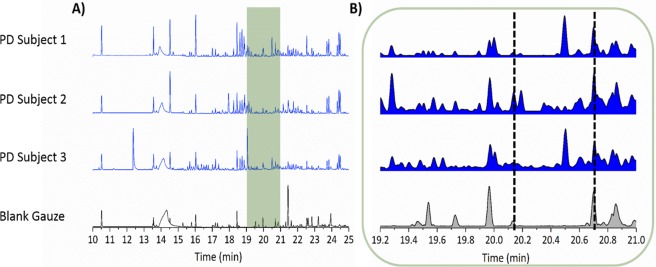
Figure 4.
Comparison of GC–MS chromatogram to description of olfactory data described by the Super Smeller: GC–MS chromatogram from three drug naïve Parkinson’s subjects and a blank gauze. (A) The 10–25 min retention time range of the chromatographic analysis in which the Super Smeller described various odors associated with different GC–MS peaks. The overlaid green shaded area shows the overlap between real time GC–MS analysis and the Super Smeller describing a “strong PD smell” via the odor port. (B) A zoom of the green highlighted area from A. This region is of particular interest as three out of four identified compounds are found here (Tables 1 and S2); it encompasses the time during which the Super Smeller described a musky PD-like scent as being “very strong” (between the time lines at 19 and 21 min) for the PD samples and not for the blank. It can be noted that none of these compounds are found in blank gauze (bottom chromatogram) within the same retention time window as shown by normalized relative peak intensities to the highest peak in each chromatogram. The area between black dotted lines highlights the presence of compounds in PD samples but complete absence in the blank gauze.

