
Figure 1.
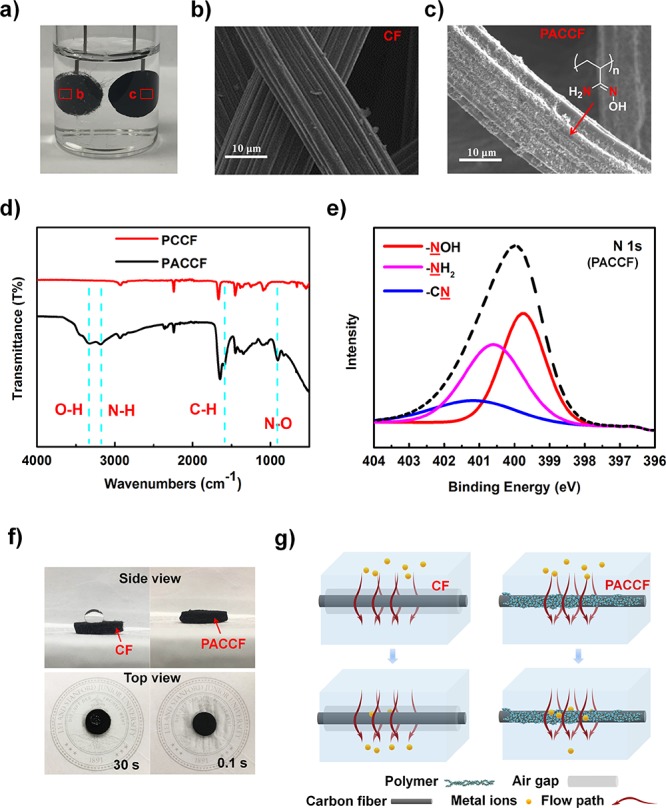
Characterization of the filtration electrode. (a) Hydrophilicity test in water. The blank CF was covered by a gas film. (b, c) SEM images of a single fiber of Blank CF and PACCF, respectively. (d) XPS spectra (N 1s) of PACCF. The red line is attributed to −NOH at 399.8 eV; the pink line is attributed to −NH2 at 400.6 eV; the blue line belongs to −CN at 401.2 eV. (e) Fourier transform infrared spectroscopy (FTIR) spectrum of materials coated with PAN before and after amidoximation reaction. Four blue dashed lines mark the new signals after reaction. (f) Permeability test of water droplet (side view). The droplet can instantly pass through the PACCF and wet the tissue printed logo (top view). (g) Schematic of metal ions in flowing water to explain the hydrophilic effect.