
Figure 4.
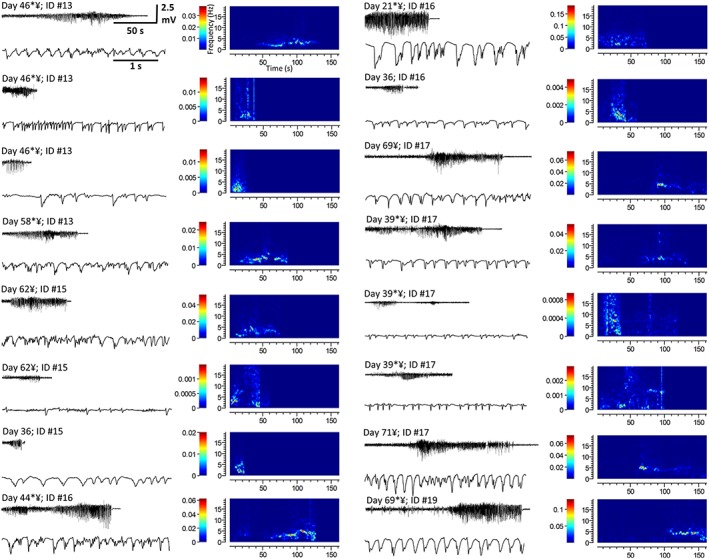
Epileptiform events recorded via EEG in rats treated with high‐dose (40.5 mg·kg−1 THC + 37.5 mg·kg−1 CBD) cannabis extract (Supporting Information Table S2). Each panel shows the EEG recording of the complete epileptiform event (top left), a shorter section of the event during the period of greatest amplitude activity represented on an extended timescale (bottom left) and a spectrographic representation of each event [right; x‐axis: time (s); y‐axis: frequency (Hz); and colour bar: power (dB·mV−2)]. * Indicates occurrence of a seizure during drug administration or within 10 min thereafter. ¥ Indicates an epileptiform event detected via EEG that was accompanied by a motor convulsion.