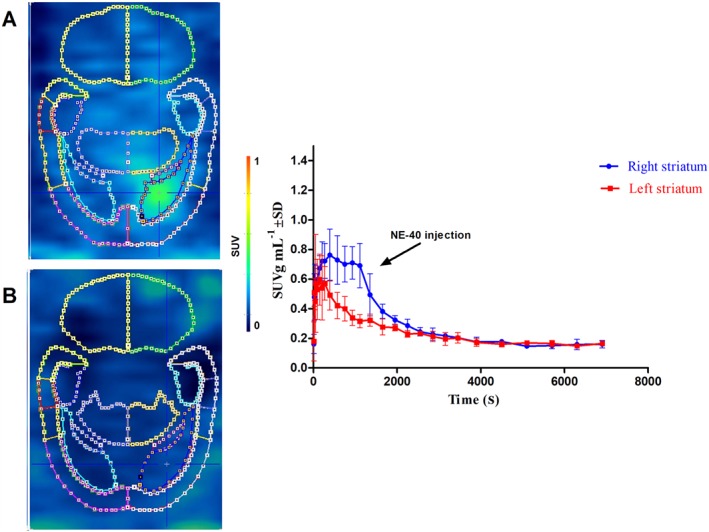
Figure 4.

PET data of [18F]MA3 displacement study in a hCB2 receptor rat model. The right striatum was stereotactically injected with AAV‐hCB2 receptor; and the left striatum was injected with control vector AAV‐eGFP. NE40 (1 mg kg−1) was injected i.v. (arrow) 20 min after tracer injection. Images (from transverse sections) corresponding to the chase experiment: summed image (0–20 min after tracer injection) before chase injection (A) and summed image (20–120 min after tracer injection) after chase injection (B), with corresponding TACs of the right and left striatum. Data are expressed as SUV. Error bars correspond to SD.
