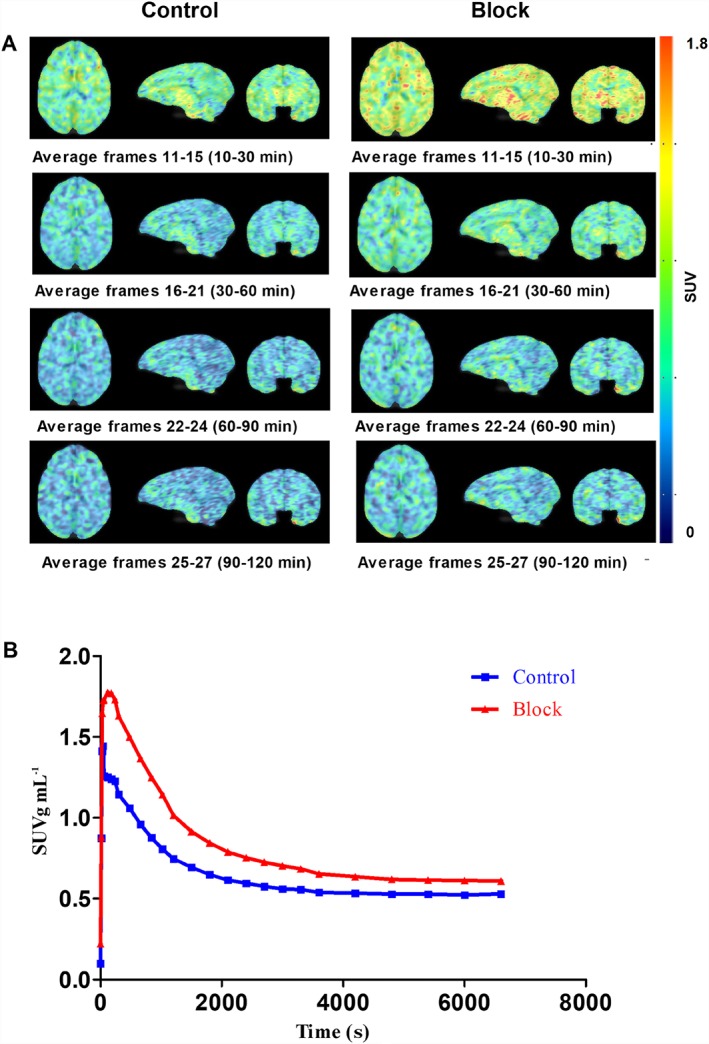
Figure 7.

PET data of [18F]MA3 in Rhesus monkey. (A) Transverse, sagittal and frontal PET sections of monkey brain. Summed images of 10–30, 30–60, 60–90 and 90–120 min after tracer injection for the baseline study (left images) and for the pretreatment study with NE40 (1 mg kg−1; i.v.) 10 min before tracer injection (right images). (B) Corresponding TACs of total monkey brain at baseline (control) and after pretreatment (block).
