
Figure 4.
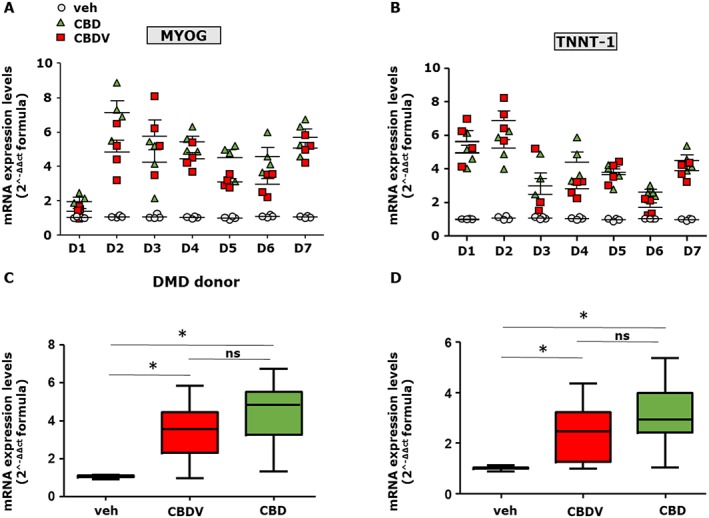
Effect of CBD and CBDV in differentiating myoblasts isolated from DMD donors. (A, B) Grouped column scatter plot showing the mRNA expression levels of MYOG and TNNT‐1 in primary human myoblasts isolated from DMD patients and induced to differentiate in the presence of vehicle (0.001% DMSO), CBD (1 μM) or CBDV (3 μM). The quantification of transcripts was performed by quantitative real‐time PCR. (C, D) The graphs show the differences in the expression level of MYOG and TNNT‐1 between vehicle and CBD (1 μM) or CBDV (3 μM) treated myoblasts, calculated by combining the DMD patient's results together. Data are expressed as 2‐ΔΔct formula relative to S16, as described in Methods. Data represent the mean ± SEM from the seven patients, repeated in quadruplicate. Data sets were compared by one‐way ANOVA followed by Bonferroni's test. Differences were considered statistically significant when *P was ≤ 0.05.