Figure 5.

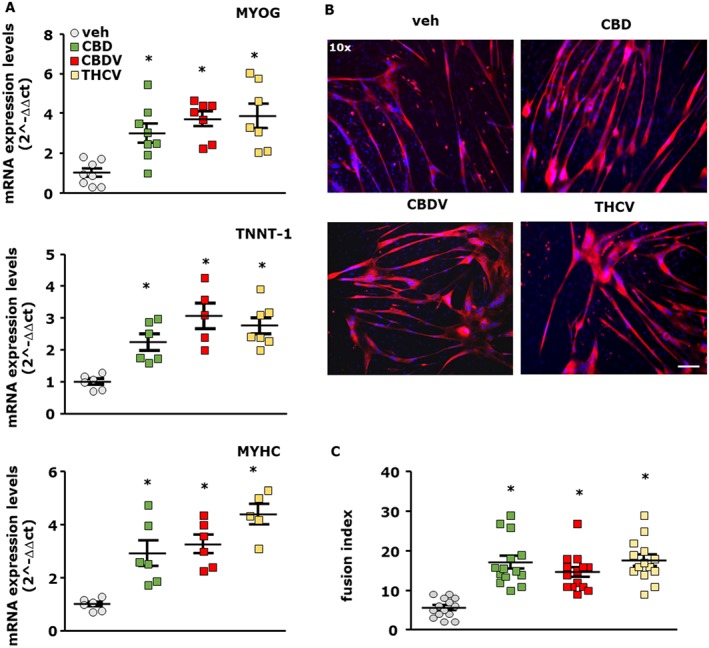
Effect of CBD, CBDV and THCV in differentiating primary human satellite cells. (A) Transcript levels of myogenin (MYOG), TNNT‐1 and MyHC in human satellite cells exposed to DM in the presence of CBD 1 μM, CBDV 3 μM and THCV 3 μM for 5 days. The quantification of transcripts for MYOG and TNNT‐1 was performed by quantitative real‐time PCR. Data represent the mean ± SEM of n ≥ 5 determinations. Data are expressed as 2‐ΔΔct relative to S16, as described in Methods. (B) Morphological analysis of myotube formation in satellite cells exposed to DM for 5 days in the presence of vehicle (0.003% DMSO, control; n = 14), CBD 1 μM (n = 14), CBDV 3 μM (n = 14) or THCV 3 μM (n = 14). MyHC (red) and DAPI (blue) (Scale bar, 10 μm). The fusion index was calculated in vehicle and CBD‐, CBDV‐ or THCV‐treated cells. Data sets were compared by use of one‐way ANOVA followed by Bonferroni's test. Differences were considered statistically significant when *P was ≤ 0.05.
