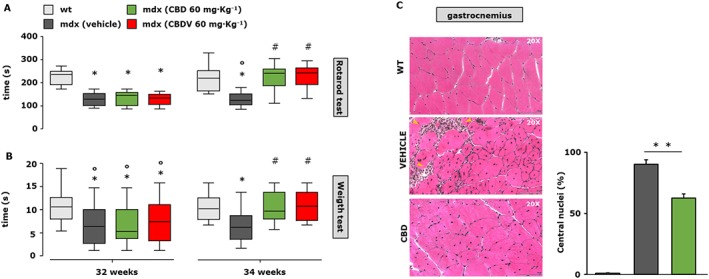
Figure 8.

Measurement of muscle strength and histological analysis in mdx mice treated with CBD and CBDV. Muscle coordination and strength by the rotarod test (A) and weight test (B) were measured in control (C57BL/10ScSnJ) and dystrophic (C57BL/10ScSn‐DMDmdx/J) mice treated with vehicle (10% ethanol + 10% Tween + 80% NaCl; n = 12), CBD (60 mg·kg−1; n = 12) or CBDV (60 mg·kg−1; n = 12) at the beginning of the treatment (32 weeks) and after 2 weeks (34 weeks, right). Control and mdx mice were treated every other day starting from week 32 to week 34 (left). Data sets were compared by one‐way ANOVA followed by Bonferroni's test. Differences were considered statistically significant when P was ≤ 0.05. *Denotes P ≤ 0.05 versus mdx control group at week 5; o P ≤ 0.05 versus mdx control group of the same age; # P ≤ 0.05 versus mdx vehicle group of the same age. (C) Representative photomicrographs of H&E‐stained transverse sections of gastrocnemius muscle isolated from wild type (wt; n = 5); mdx treated with vehicle (10% ethanol + 10% Tween + 80% NaCl; n = 5) or CBD (60 mg·kg−1; n = 5) i.p. from week 32 to week 34 of age. Scale bars = 100 μm. (D) The bar graph indicates the number of centralized nuclei in the muscle fibres of control and CBD‐treated mdx mice. Data sets were compared by one‐way ANOVA followed by Bonferroni's test. **P ≤ 0.001.
