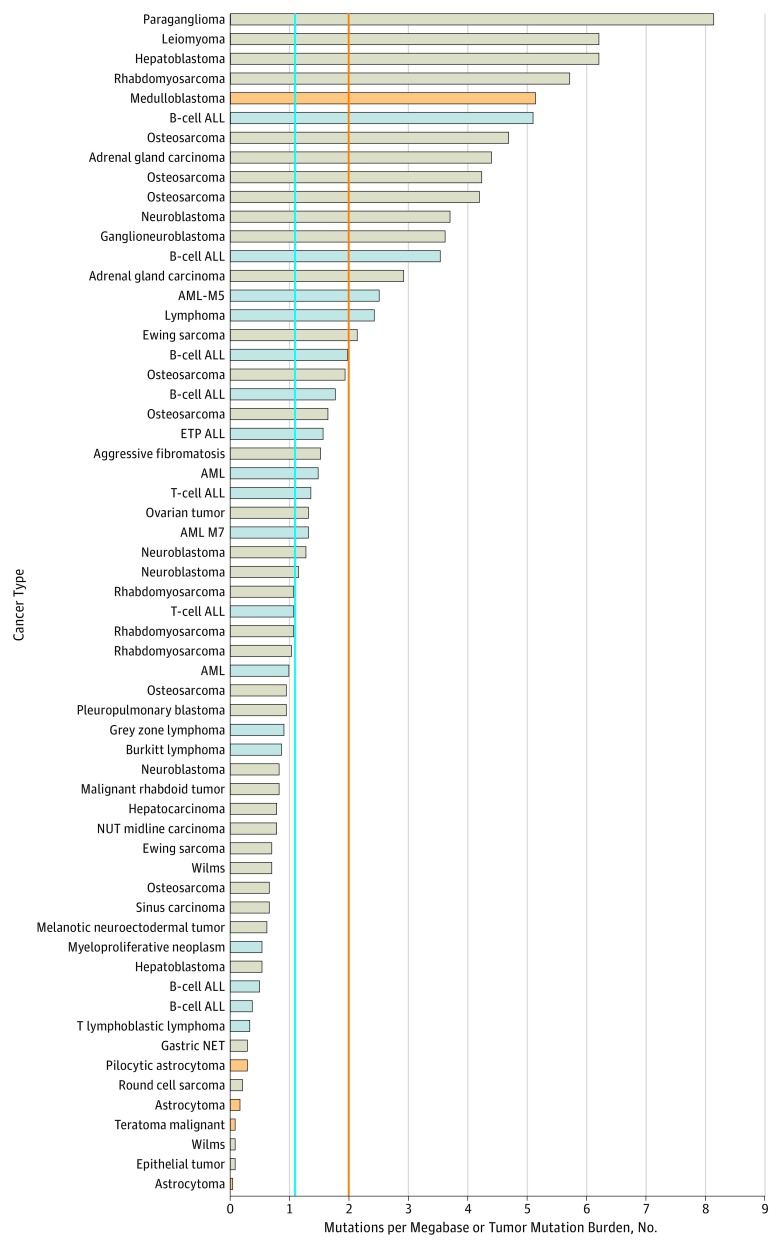
Figure 2. Tumor Mutation Burden for 62 Patients .
Distribution of the somatic tumor mutation burden is defined as the number of nonsynonymous coding mutations per megabase. Each bar indicates the mutation number in each sample. The blue line indicates the median of the TMB in the cohort (1.09), and the orange line indicates pediatric high threshold, as determined by Gröbner et al.25 Solid tumors are labeled in tan, brain tumors in orange, and hematological malignant neoplasms in blue.
ALL indicates acute lymphoblastic leukemia; AML, acute myeloid leukemia; ETP, early T-cell precursor; NET, neuroendocrine tumors; NUT, nuclear protein of the testis.

