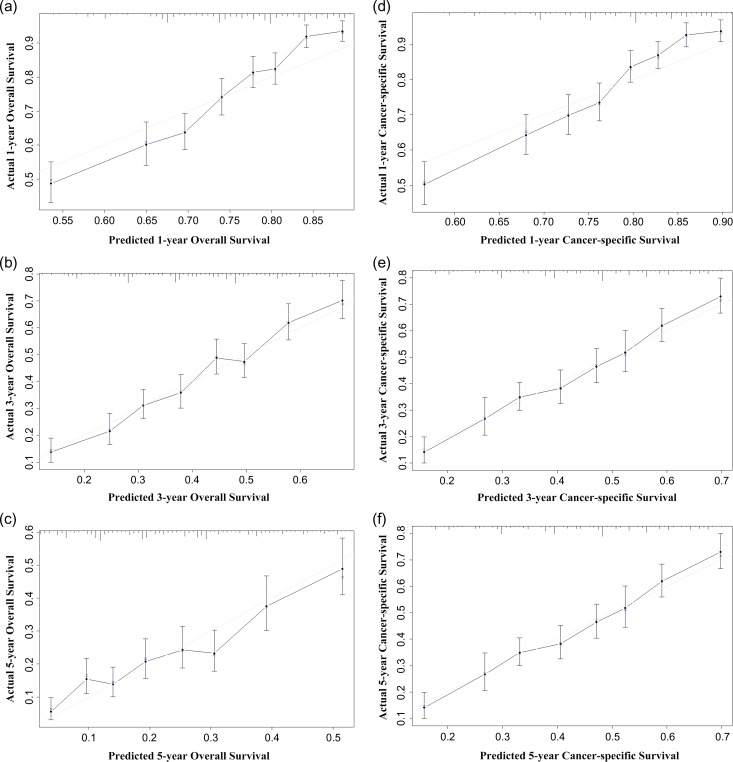
Figure 3.
Internal calibration plots. (a) 1-year, (b) 3-year and (c) 5-year overall survival (OS) nomogram calibration curves; (d) 1-year, (e) 3-year and (f) 5-year colorectal cancer-specific survival (CCSS) nomogram calibration curves. The dashed line represents a perfect match between the nomogram-predicted probability (x-axis) and the actual probability calculated by Kaplan–Meier analysis (y-axis). Closer distances from the points to the dashed line indicates better agreement between the predicted and actual outcomes.

