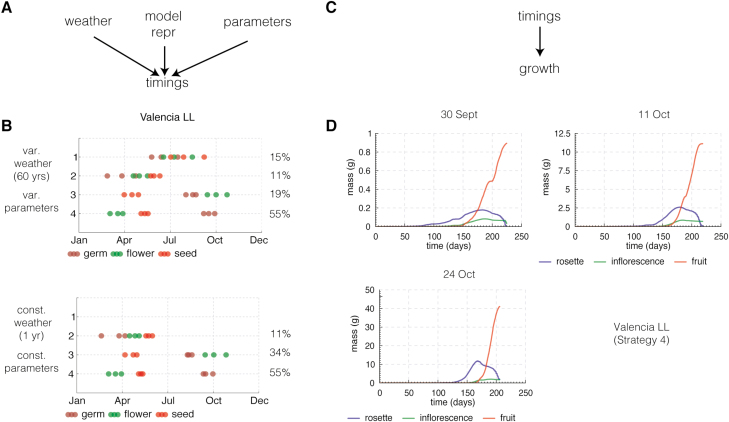
Fig. 10.
Robustness of timing and growth simulation results. (A) Sources of variability for the timing results. (B) Timing results for variable weather (60 years) and variable genetic parameters chosen from a distribution and timing results for simulations with constant weather (same 1-year weather over 60 years) and constant parameters. The timings of the strategies are very similar but strategy 1 life cycles have moved to strategy 3. This could be because of the particular year of weather data we used for the simulations. (C) Sources of variability for growth results. (D) Growth simulation results starting from three different germination dates (corresponding to 25th, 50th, and 75th percentiles of the distribution of germination times) of strategy 4 in Valencia LL (Fig. 8).

