Fig. 6.
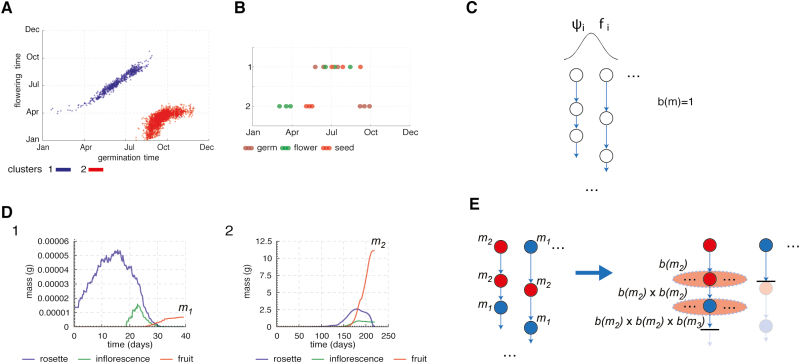
The two-stage simulation of the population level model. (A) The distributions of developmental events (germination, flowering) from the phenology-only simulation of the population model (C) with the identification of two clusters representing two distinct strategies (blue, red). (B) The 25th, 50th, and 75th percentiles of the distributions of developmental events of the two clusters from (A) (cluster labels on y-axis). Germination time distributions are in brown, flowering time distributions are in green and seed dispersal distributions in red. (C) Illustration of the phenology only simulation with growth independent birth function b(m)=1 (each plant makes a single seed). The choice of, ψi (seed dormancy level) and fi (initial floral repression) is done probabilistically through a normal distribution. (D) Results of simulations of the growth models for the median dates of developmental events (B) for the clusters identified in (A). m1, m2 are the final fruit masses for a plant with median developmental event timings for clusters 1 and 2, respectively (as identified and shown in A, B). (E) Illustration of the assignment of fruit masses to the lifecycles of the phenology-only simulation (C) according to their clusters. m1, m2 refer to final fruit masses for a median plant in clusters 1 and 2 (from growth simulations in (D) and same two clusters in (A, B)). This recovers the full branching population process where the horizontal bars indicate a lineage dying out (b(m)=0 at that generation, no reproduction) and the potential rest of the lineages is shaded. The breadth of the ellipses indicates the reproductive success when there is reproduction (b(m)>0).

