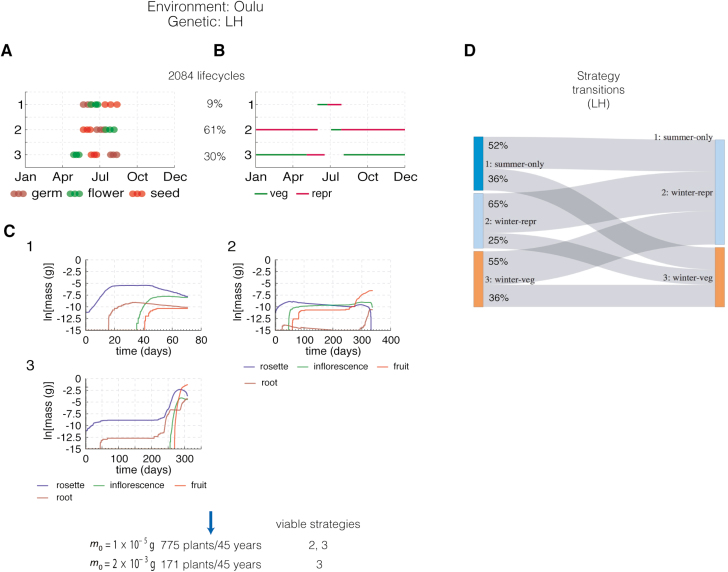
Fig. 9.
Simulation results for a combined variant in Oulu (LH, low dormancy, high floral repression). (A) Results of the phenology-only simulation results. The 25th, 50th, and 75th percentile of the distribution of developmental events are shown for each identified cluster. (B) Illustration of growth stages over a year for each cluster according to the median time of the distribution of developmental events for each cluster. (C) Growth simulations over the growth period shown in (B) for each cluster. (D) Probabilities of successive strategies.

