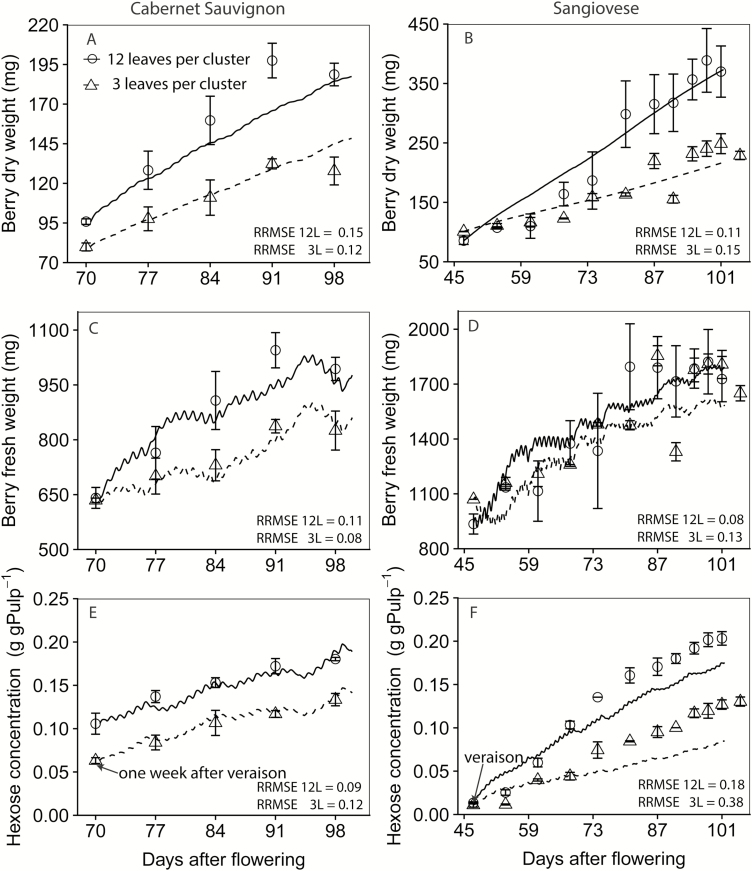
Fig. 3.
Model verification (12 leaves per cluster, solid lines) and validation (three leaves per cluster, dashed lines) of berry DW (A and B) and FW (C and D). Left panels are fruiting-cutting Cabernet Sauvignon, and right panels are one-cane-pruned Sangiovese. Circles and triangles are observed values, and lines are simulated values. The model was calibrated based on the dynamics of berry DW and FW under 12LC per cluster for using the data set of Bobeica et al. (2015) for both Cabernet Sauvignon and Sangiovese. The data set of 3LC per cluster was reserved for validation. The dynamics of berry hexose concentration was the emerging property of the model. RRMSE is the normalized root mean square error and represents the SD of the differences between predicted values and observed values divided by the overall mean of the observed values.

