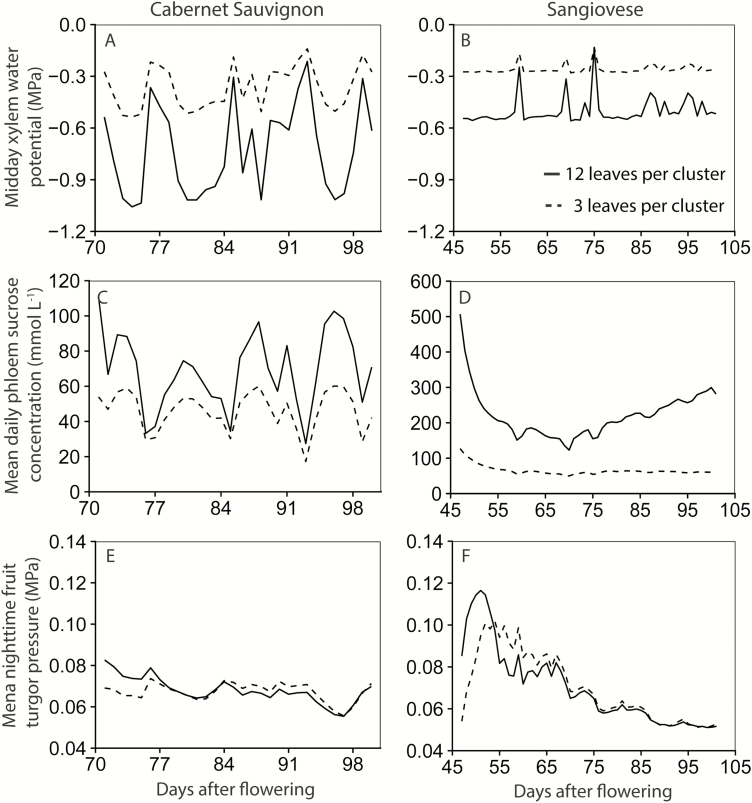
Fig. 4.
Mean mid-day xylem water potential (A and B), mean daily phloem sucrose concentration (C and D), and mean night-time turgor pressure (E and F). Left panels are fruiting-cutting Cabernet Sauvignon, and right panels are one-cane-pruned Sangiovese. The data sets of Bobeica et al. (2015) for both Cabernet Sauvignon and Sangiovese were used for the simulation. Solid lines represent the vines with 12 leaves per cluster, and dashed lines are vines with three leaves per cluster. The high phloem sucrose concentration at the start of the simulation could be because: (i) the input non-structural carbon concentration for leaf and stem was higher than the actual condition, thus the model requires some time to stabilize based on the current environmental condition; or (ii) berry has a lower sugar uptake capacity at the start of the simulation due to a lower dry matter.

