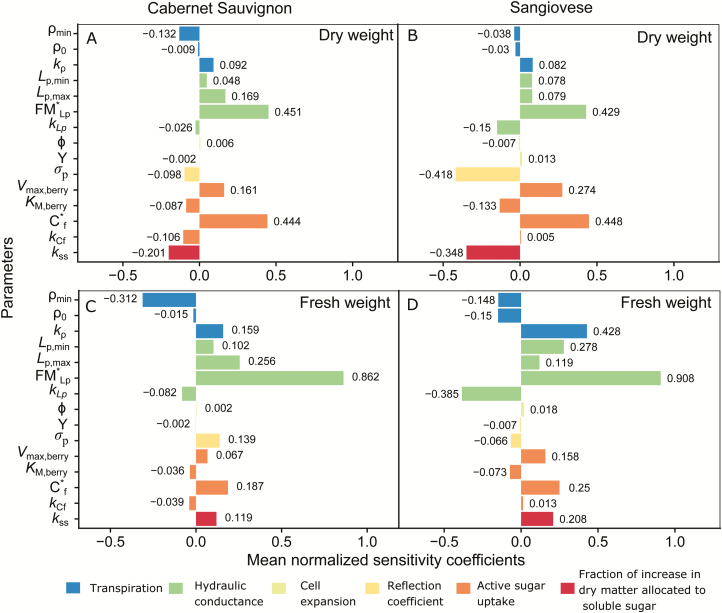
Fig. 6.
Mean normalized sensitivity coefficients (bars) calculated for the final berry DW (A and B) and FW (C and D) to variations in parameters within the berry growth module. The default value of a parameter as noted in Table 1 was changed at 10% intervals from –50% to +50%, excluding the default value, while all other parameters were kept at the default values during the sensitivity analysis. Left panels are Cabernet Sauvignon, and right panels are Sangiovese. Different coloured Vmax,leaf represent different physiological processes.

