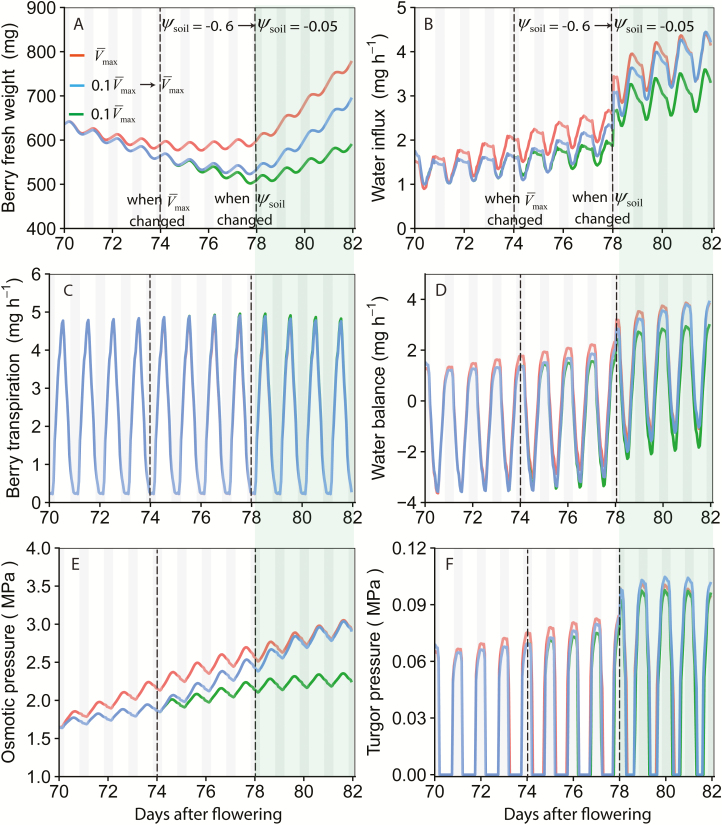
Fig. 8.
The dynamics of berry FW (A), water influx (B), berry surface transpiration (C), water balance (D), osmotic pressure (E), and turgor pressure (F) under varying sugar uptake capacity (Vmax,berry) with water stress for the first 8 d (70–77 d after flowering) and well watered for the remaining 4 d (78–81 d after flowering). Red lines were simulated with constant default Vmax,berry (Table 1). Blue lines were simulated with 0.1Vmax,berry for the first 4 d, and then switched to Vmax,berry for the remaining 8 d. Green lines were simulated with 0.1Vmax,berry throughout the whole period. Simulation was run based on the model set up for the fruiting-cutting Cabernet Sauvignon system. Climatic conditions are shown in Supplementary Fig. S5. Shaded areas indicated the night-time, 20.00 h to 05.00 h. The simulated dynamics of berry dry weight, hexose concentration, photosynthesis rate, transpiration rate, xylem water potential, and phloem sucrose concentration are shown in Supplementary Fig. S12.

