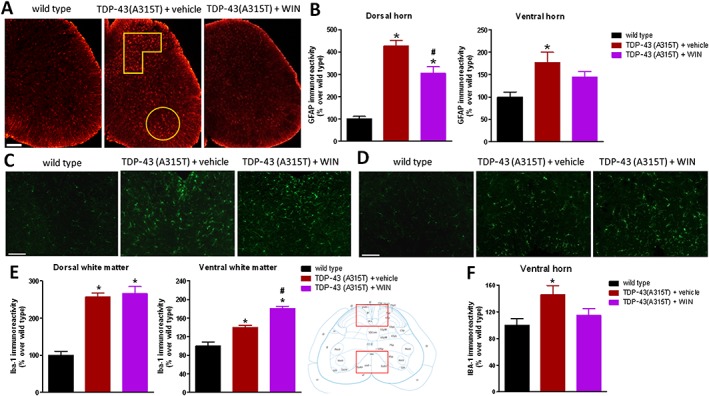
Figure 3.

GFAP (panels A and B) and Iba‐1 (panels C–F) immunofluorescence analysis, including representative images (scale bar = 300 μm for GFAP and 200 μm for Iba‐1), in the dorsal and ventral horns for GFAP (analysed areas are marked in the images), and in the dorsal and ventral white matter (indicated in the graphical schemes with representative images in panels C and D) and in the ventral horn for Iba‐1 of the lumbar spinal cord of male TDP‐43 (A315T) transgenic and wild‐type male mice after the daily treatment with WIN55,212‐2 (5 mg·kg−1) or vehicle from day 65 up to day 90 after birth. Values are means ± SEM of 12 animals per group. Data were assessed by one‐way ANOVA followed by the Bonferroni test [*P < 0.05 vs. wild type; #P < 0.05 vs. TDP‐43 (A315T) transgenic mice treated with vehicle].
