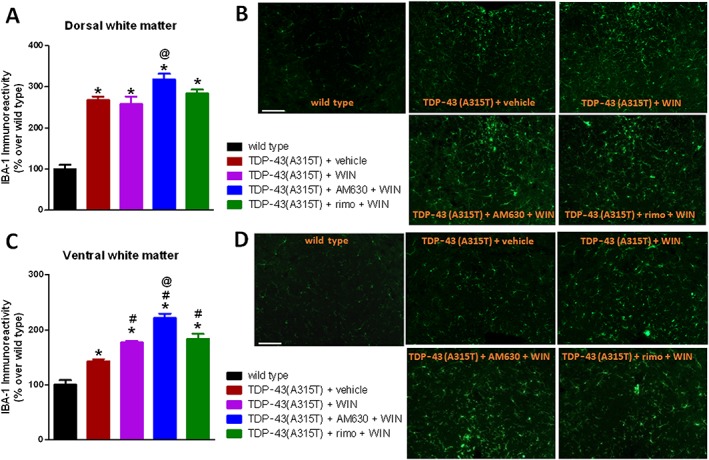
Figure 6.

Iba‐1 immunofluorescence analysis (panels A and C), including representative images (panels B and D; scale bar = 200 μm), in the dorsal and ventral white matter areas (indicated in the graphical schemes in Figure 3) of the lumbar spinal cord of male TDP‐43 (A315T) transgenic and wild‐type male mice after the daily treatment with WIN55,212‐2 (5 mg·kg−1), in the absence or presence of the selective CB1 receptor antagonist rimonabant (5 mg·kg−1) or the selective CB2 receptor antagonist AM630 (5 mg·kg−1), or vehicle, from day 65 up to day 90 after birth. Values are means ± SEM of 10 animals per group. Data were assessed by one‐way ANOVA followed by the Bonferroni test [*P < 0.05 vs. wild type; #P < 0.05 vs. TDP‐43 (A315T) transgenic mice treated with vehicle; @P < 0.05 vs. TDP‐43 (A315T) transgenic mice treated with WIN55,212‐2].
