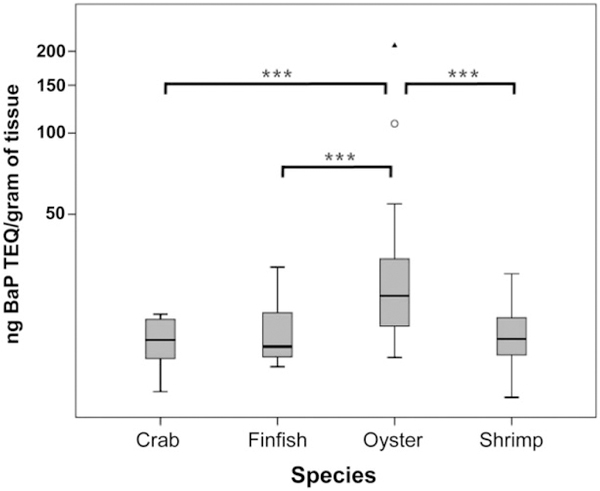
Figure 5.

PAH levels in Gulf seafood by species. Box plots of PAH levels as B[a]P Toxic Equivalency Quotients in nanograms per gram of tissue in Gulf seafood by species compiled from all the samples collected across all locations and times. Horizontal line in the box denotes the median, and the upper and lower limits of the box represent the third and first quartiles, respectively. Open circles denote extreme values that were included in the statistical analyses. The solid triangle represents an outlier not used in the analyses. Significance is indicted by asterisk, ***p <.005.
