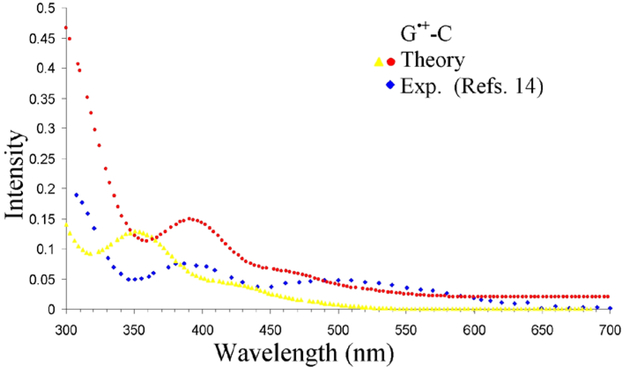
Figure 2.
TD-ωb97xd-PCM/6-31G(3df,p) calculated vertical absorption spectrum of G•+-C (yellow color) and 40 nm red-shifted (red color). The experimental data points (blue color) were taken from Figure 1 of reference 14, the pulse radiolysis of one-electron oxidized deoxyguanosine at pH 3.1 and monitored at 10 μs after pulse radiolysis. The simulated spectra of 20 lowest calculated transitions were convoluted using a Gaussian function with a half width at half maximum of 30 nm. The red color curve is y-shifted by 0.02.

