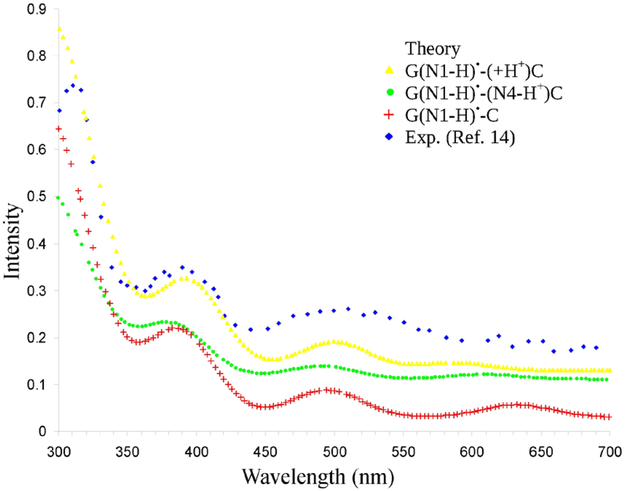
Figure 3.
TD-ωb97xd-PCM/6-31G(3df,p) calculated vertical absorption spectra of G(N1-H)•-(+H+)C (yellow color), G(N1-H)•-(N4-H+)C (green color) and G(N1-H)•-C (red color) red-shifted by 40 nm are shown. The experimental data points (blue color) were taken form Figure 1 of reference 14, the pulse radiolysis of one-electron oxidized deoxyguanosine at pH 6.6 and monitored at 10 μs after pulse radiolysis. The simulated spectra of 20 lowest transitions were convoluted using a Gaussian function with a half width at half maximum of 30 nm. For clarity in presentation spectra in blue, yellow, green and red are y-shifted by 0.12, 0.09, 0.05 and 0.01, respectively.

